|
|
FutureGrid Cloud Metric |
|
|
FutureGrid Cloud Metric |
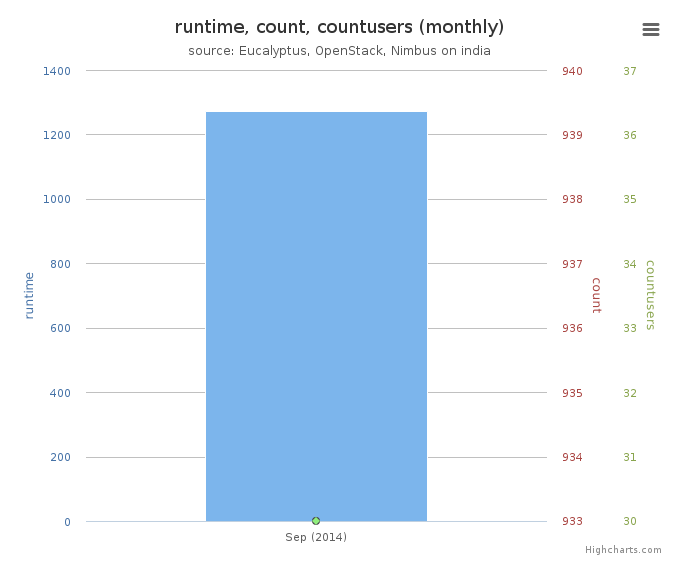
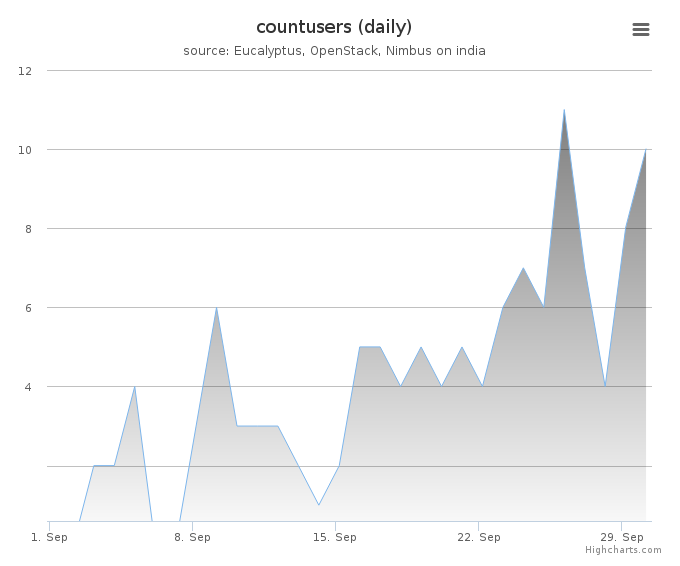
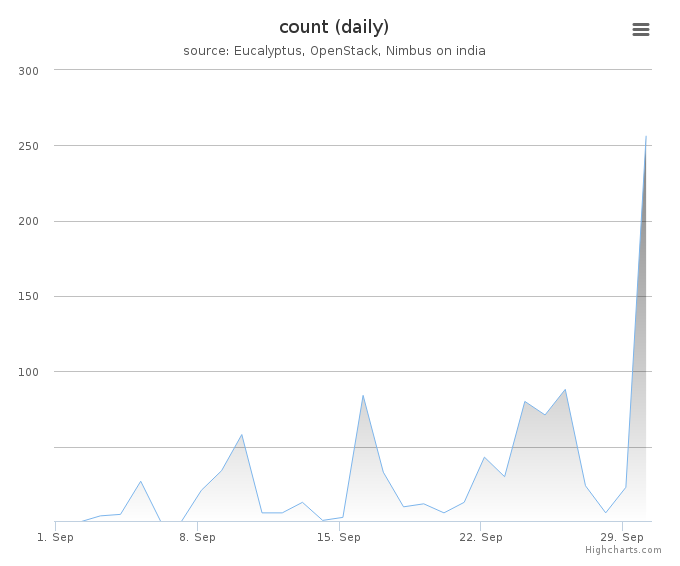
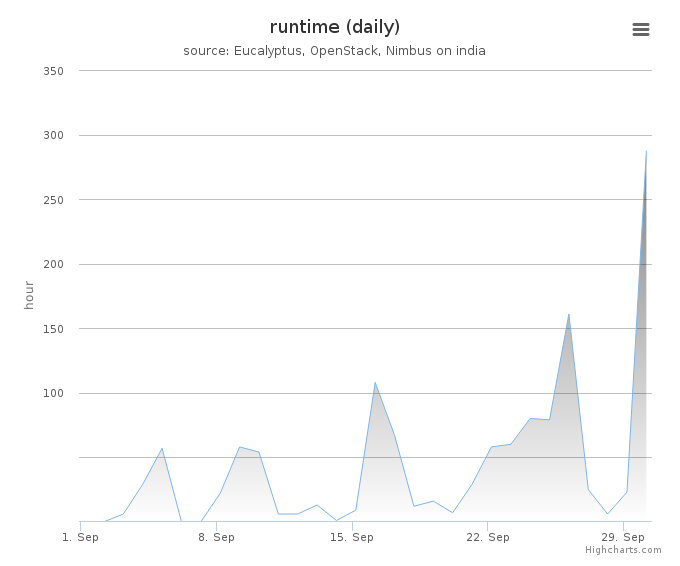
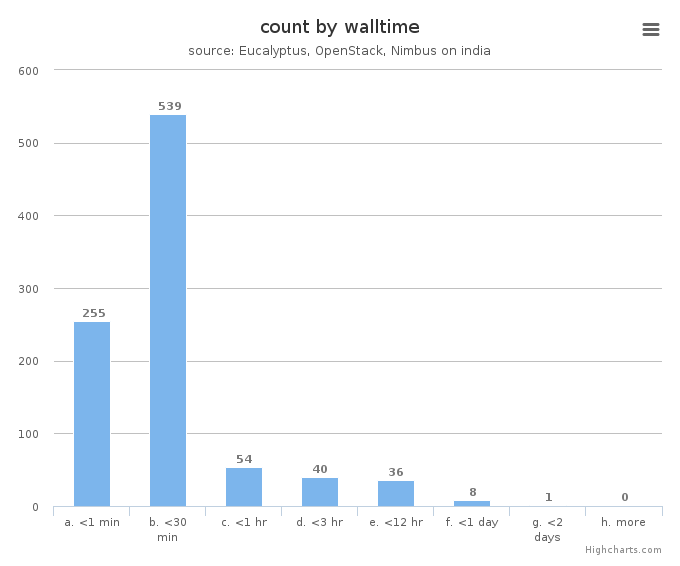
Period: September 01 – September 30, 2014
Cloud(IaaS): openstack, eucalyptus
Hostname: india
| Project | Value |
|---|---|
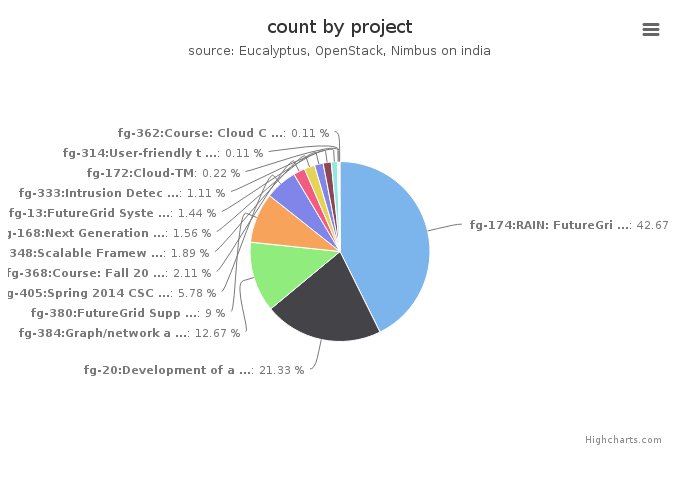
| fg-174:RAIN: FutureGrid Dynamic provisioning Framework | 384 |
| fg-20:Development of an information service for FutureGrid | 192 |
| fg-384:Graph/network analysis Resource manager | 114 |
| fg-380:FutureGrid Support for BigData MOOC | 81 |
| fg-405:Spring 2014 CSCI-B649 Cloud Computing MOOC for residential and online students | 52 |
| fg-368:Course: Fall 2013 P434 Distributed Systems Undergraduate Course | 19 |
| fg-348:Scalable Framework for Agent-Based Computing | 17 |
| fg-168:Next Generation Sequencing in the Cloud | 14 |
| fg-13:FutureGrid Systems Development and Prototyping | 13 |
| fg-333:Intrusion Detection and Prevention for Infrastructure as a Service Cloud Computing System | 10 |
| fg-172:Cloud-TM | 2 |
| fg-314:User-friendly tools to play with cloud platforms | 1 |
| fg-362:Course: Cloud Computing and Storage (UF) | 1 |
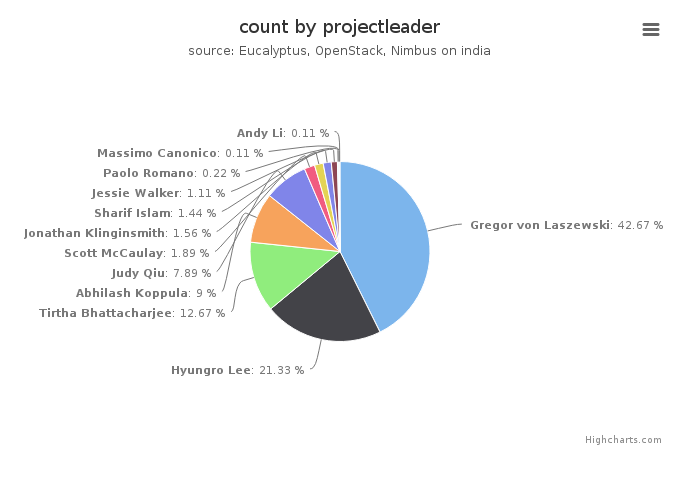
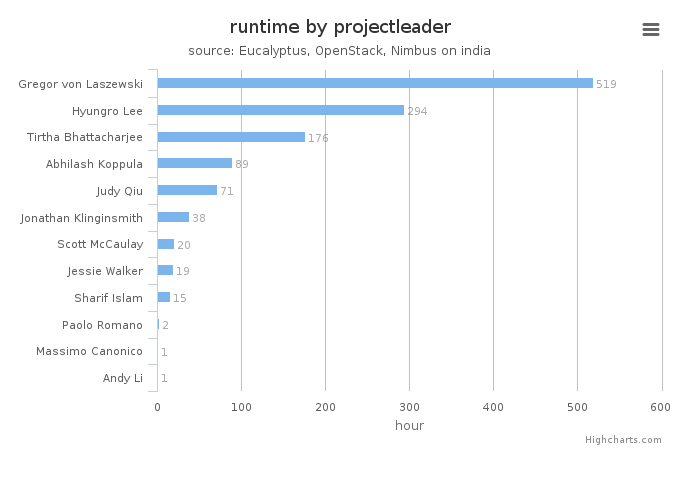
| Projectleader | Value |
|---|---|
| Gregor von Laszewski | 384 |
| Hyungro Lee | 192 |
| Tirtha Bhattacharjee | 114 |
| Abhilash Koppula | 81 |
| Judy Qiu | 71 |
| Scott McCaulay | 17 |
| Jonathan Klinginsmith | 14 |
| Sharif Islam | 13 |
| Jessie Walker | 10 |
| Paolo Romano | 2 |
| Massimo Canonico | 1 |
| Andy Li | 1 |
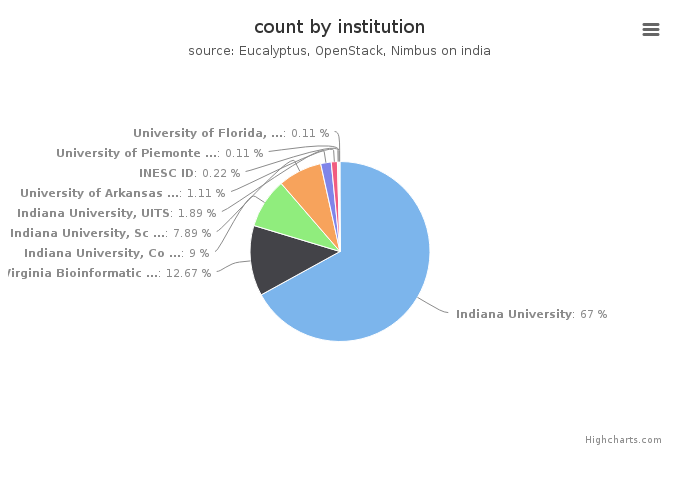
| Institution | Value |
|---|---|
| Indiana University | 603 |
| Virginia Bioinformatics Institute, Virginia Polytechnic Institut | 114 |
| Indiana University, Community Grids Lab | 81 |
| Indiana University, School of Informatics and Computing | 71 |
| Indiana University, UITS | 17 |
| University of Arkansas at Pine Bluff , Computer Science | 10 |
| INESC ID | 2 |
| University of Piemonte Orientale, Computer Science Department | 1 |
| University of Florida, Department of Electrical and Computer Eng | 1 |
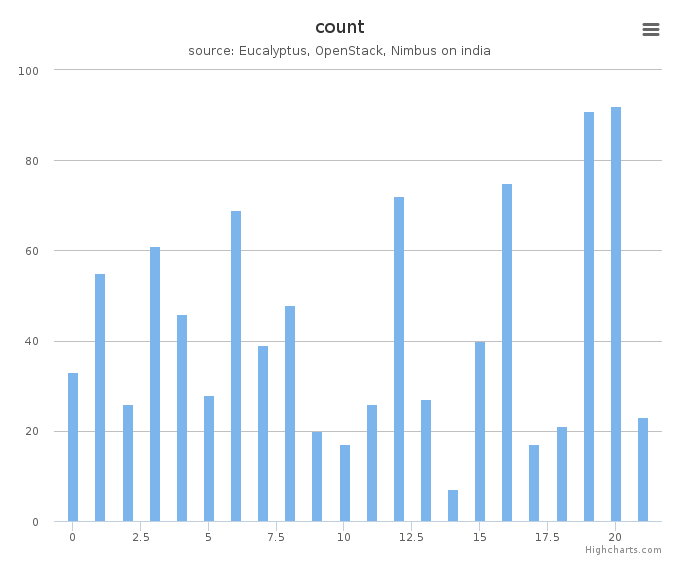
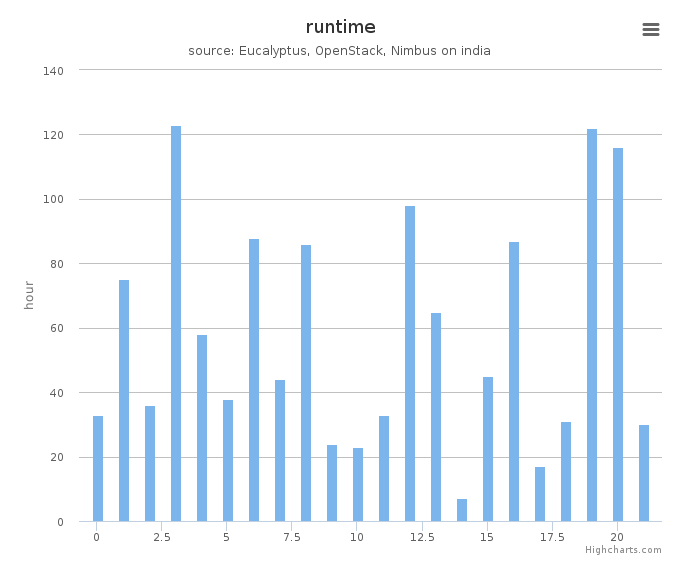
System information shows utilization distribution as to VMs count and wall time. Each cluster represents a compute node.