|
|
FutureGrid Cloud Metric |
|
|
FutureGrid Cloud Metric |
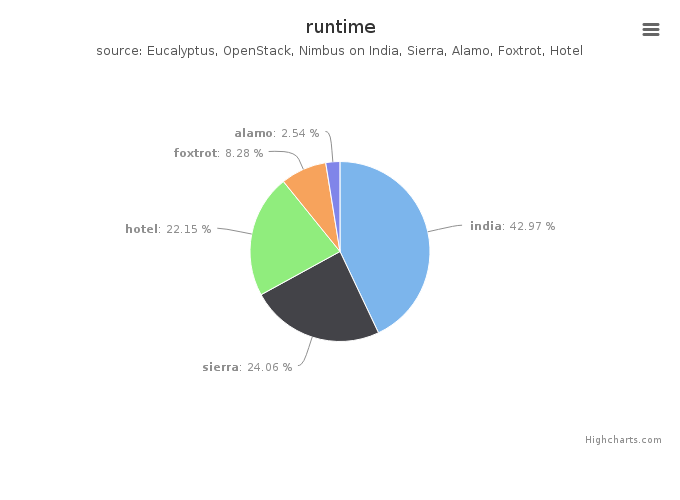
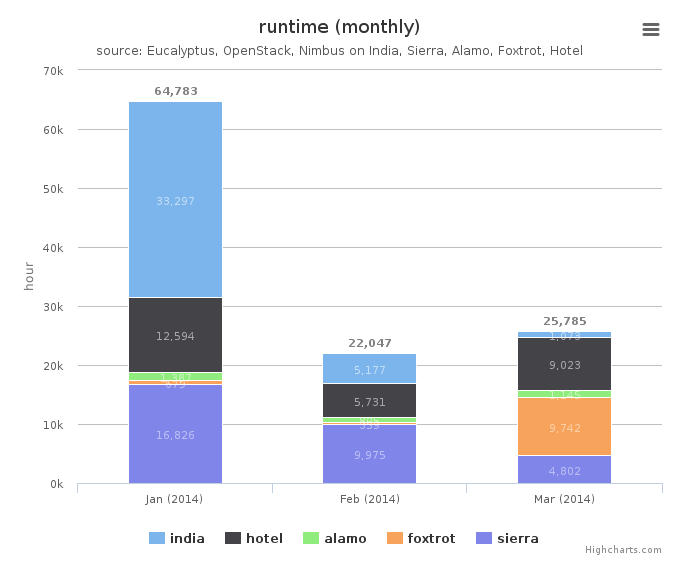
Period: January 01 – March 31, 2014
| Total | Value |
|---|---|
| india | 56522.0 |
| sierra | 31654.0 |
| hotel | 29134.0 |
| foxtrot | 10893.0 |
| alamo | 3337.0 |
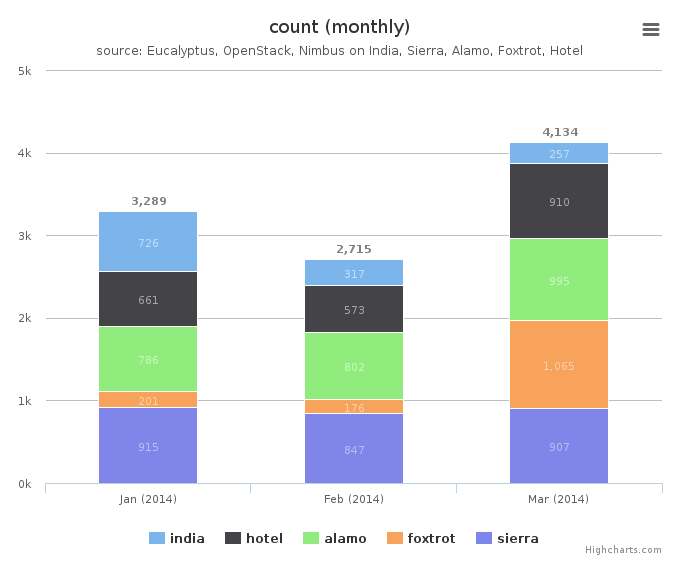
Period: January 01 – March 31, 2014
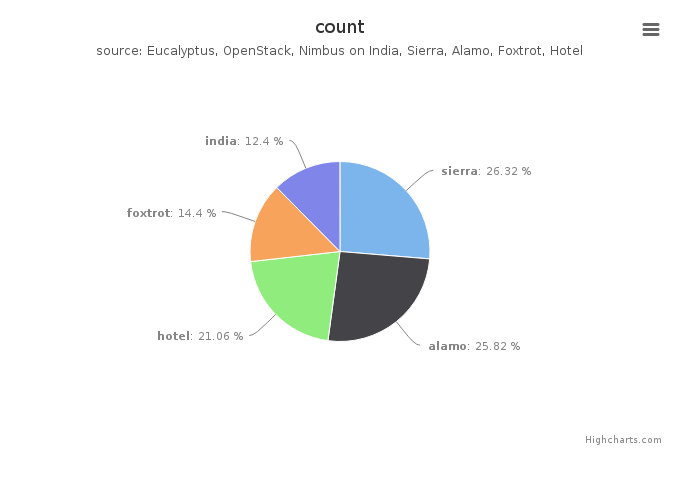
Period: January 01 – March 31, 2014
| Total | Value |
|---|---|
| sierra | 2633 |
| alamo | 2583 |
| hotel | 2106 |
| foxtrot | 1440 |
| india | 1240 |
Period: January 01 – March 31, 2014
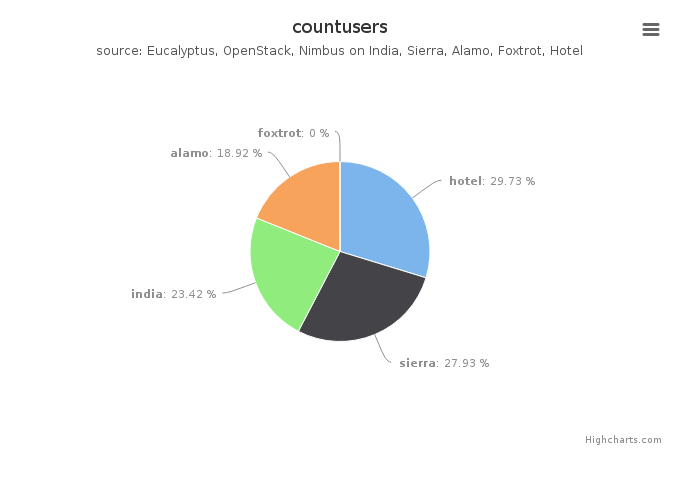
Period: January 01 – March 31, 2014
| Total | Value |
|---|---|
| hotel | 33 |
| sierra | 31 |
| india | 26 |
| alamo | 21 |
| foxtrot | 0 |
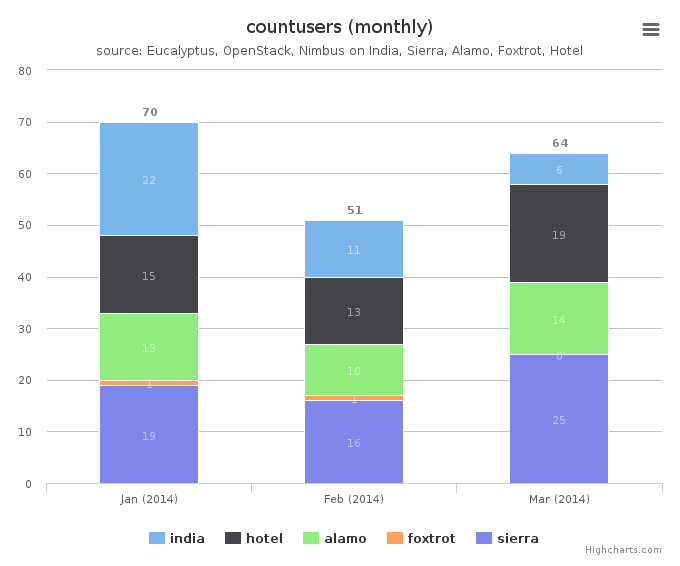
Period: January 01 – March 31, 2014