|
|
FutureGrid Cloud Metric |
|
|
FutureGrid Cloud Metric |
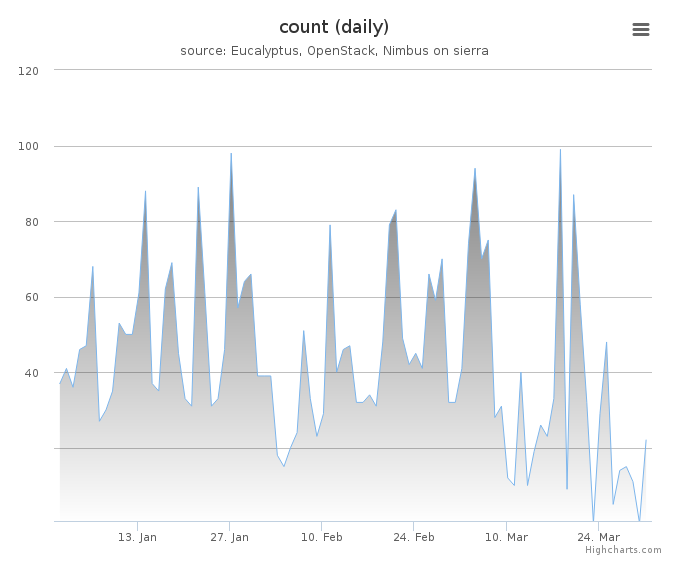
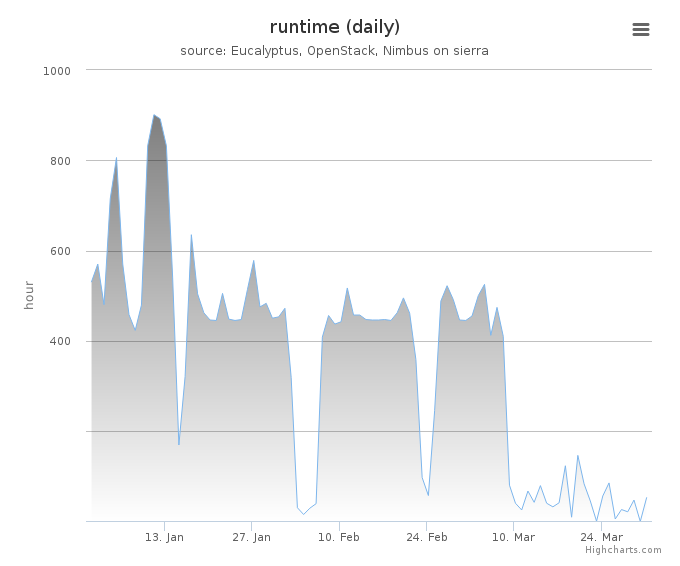
Period: January 01 – March 31, 2014
Cloud(IaaS): nimbus, openstack, eucalyptus
Hostname: sierra
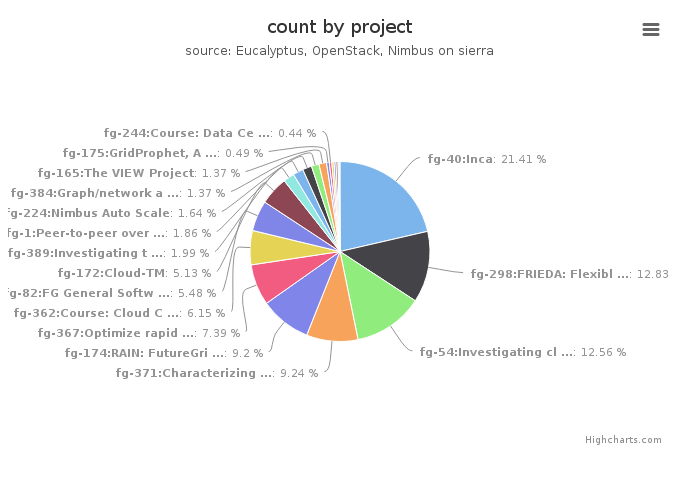
| Project | Value |
|---|---|
| fg-40:Inca | 484 |
| fg-298:FRIEDA: Flexible Robust Intelligent Elastic Data Management | 290 |
| fg-54:Investigating cloud computing as a solution for analyzing particle physics data | 284 |
| fg-371:Characterizing Infrastructure Cloud Performance for Scientific Computing | 209 |
| fg-174:RAIN: FutureGrid Dynamic provisioning Framework | 208 |
| fg-367:Optimize rapid deployment and updating of VM images at the remote compute cluster | 167 |
| fg-362:Course: Cloud Computing and Storage (UF) | 139 |
| fg-82:FG General Software Development | 124 |
| fg-172:Cloud-TM | 116 |
| fg-389:Investigating the Apache Big Data Stack | 45 |
| fg-1:Peer-to-peer overlay networks and applications in virtual networks and virtual clusters | 42 |
| fg-224:Nimbus Auto Scale | 37 |
| fg-384:Graph/network analysis Resource manager | 31 |
| fg-165:The VIEW Project | 31 |
| fg-175:GridProphet, A workflow execution time prediction system for the Grid | 11 |
| fg-244:Course: Data Center Scale Computing | 10 |
| fg-382:Reliability Analysis using Hadoop and MapReduce | 9 |
| fg-372:Mobile Device Computation Offloading over SocialVPNs | 8 |
| fg-10:TeraGrid XD TIS(Technology Insertion Service) Technology Evaluation Laboratory | 8 |
| fg-316:Course: Cloud Computing Class - third edition | 5 |
| fg-136:JGC-DataCloud-2012 paper experiments | 3 |
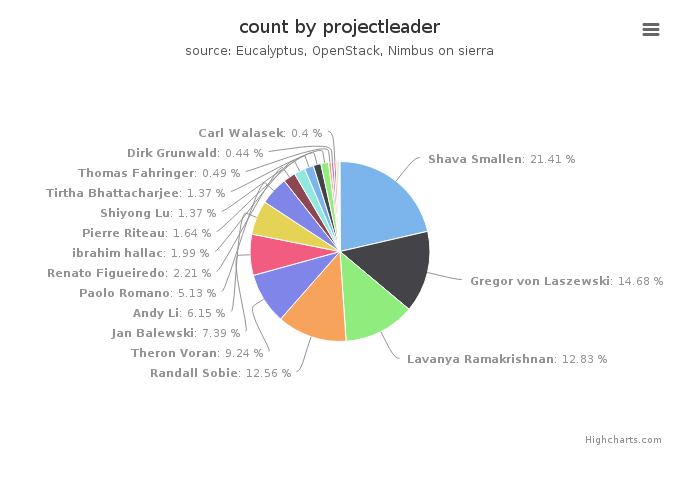
| Projectleader | Value |
|---|---|
| Shava Smallen | 484 |
| Gregor von Laszewski | 332 |
| Lavanya Ramakrishnan | 290 |
| Randall Sobie | 284 |
| Theron Voran | 209 |
| Jan Balewski | 167 |
| Andy Li | 139 |
| Paolo Romano | 116 |
| Renato Figueiredo | 50 |
| ibrahim hallac | 45 |
| Pierre Riteau | 37 |
| Shiyong Lu | 31 |
| Tirtha Bhattacharjee | 31 |
| Thomas Fahringer | 11 |
| Dirk Grunwald | 10 |
| Carl Walasek | 9 |
| John Lockman | 8 |
| Massimo Canonico | 5 |
| Mats Rynge | 3 |
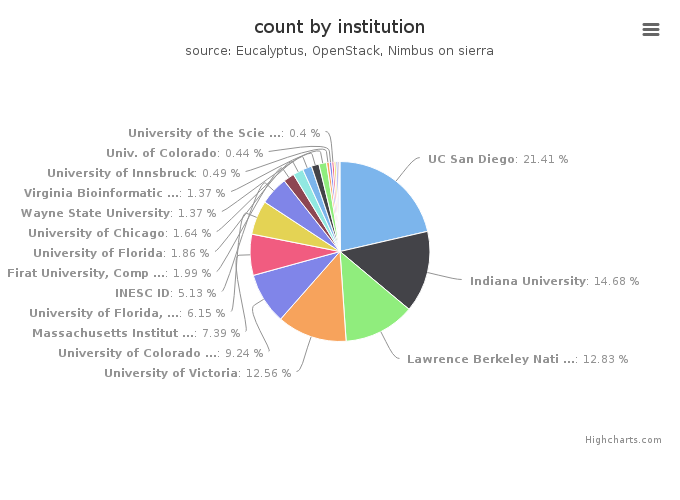
| Institution | Value |
|---|---|
| UC San Diego | 484 |
| Indiana University | 332 |
| Lawrence Berkeley National Lab | 290 |
| University of Victoria | 284 |
| University of Colorado at Boulder, Computer Science Department | 209 |
| Massachusetts Institute of Technology, Laboratory for Nuclear Sc | 167 |
| University of Florida, Department of Electrical and Computer Eng | 139 |
| INESC ID | 116 |
| Firat University, Computer Science Department | 45 |
| University of Florida | 42 |
| University of Chicago | 37 |
| Wayne State University | 31 |
| Virginia Bioinformatics Institute, Virginia Polytechnic Institut | 31 |
| University of Innsbruck | 11 |
| Univ. of Colorado | 10 |
| University of the Sciences , Mathematics, Physics, and Statistic | 9 |
| University of Texas at Austin | 8 |
| University of Florida, Electrical and Computer Engineering | 8 |
| University of Piemonte Orientale, Computer Science Department | 5 |
| USC | 3 |
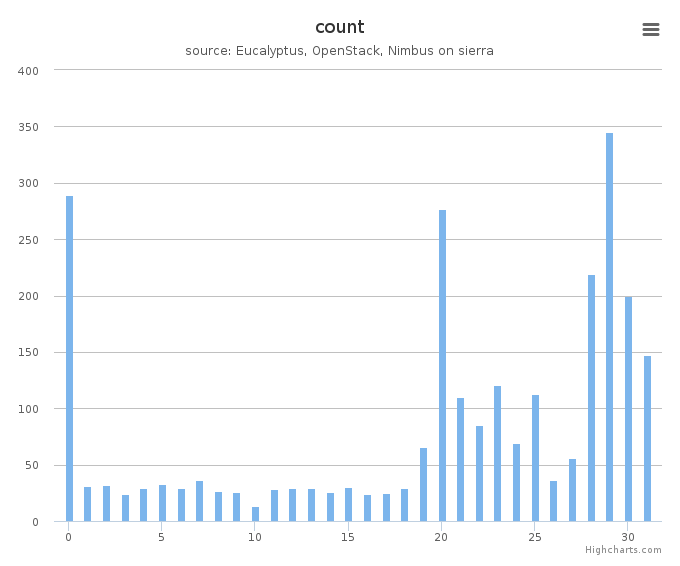
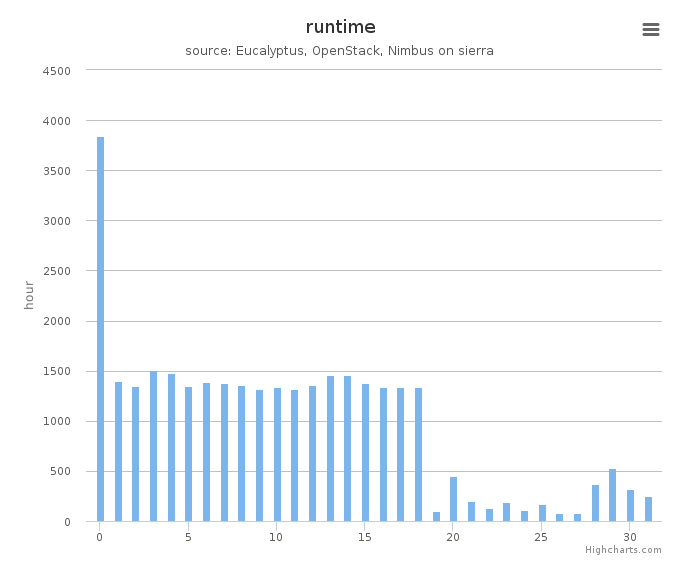
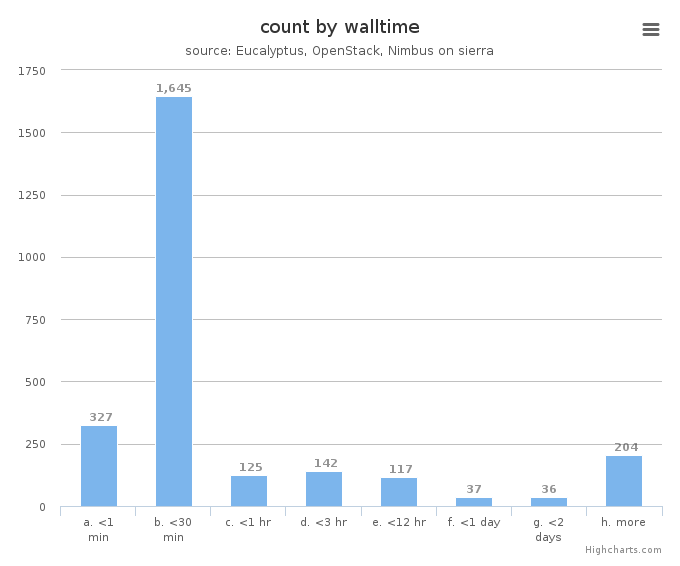
System information shows utilization distribution as to VMs count and wall time. Each cluster represents a compute node.