Performance evaluation of MapReduce applications
Abstract
In this research we elicit the main performance factors when a MapReduce application runs on its middleware in different virtual machines. For this work a system monitor is designed to aggregate information about the status of a MapReduce application and the middleware for the MapReduce application. The result of the experiment will be used to classify the type of a MapReduce application and to identify the performance barriers of the application.
Intellectual Merit
This research is import to identify the characteristics of computing resources for running a MapReduce application efficiently. FutureGrid platform is proper to this research because it provides diverse experimental environments.
Broader Impact
In educational point of view the result of the experiment can be used for understanding the behavior of MapReduce application.
Use of FutureGrid
NOTE: NEED TO BE FILLED BY THE PROJECT LEAD
Scale Of Use
a few VMs for an experiment
Publications
Results
Extended Abstract : Performance evaluation of MapReduce applications
Yunhi Kang
Pervasive Technology Institute at IU
Bloomington, IN
e-mail: yunh.kang@gmail.com
Abstract
The purpose of this project is focused on evaluating performance of two kinds of MapReduce applications: a data intensive application and a computational intensive application. For this work, we construct a virtualized cluster systems made of the VM instances for experiments in the FutureGrid. What we have observed in the experiments is that the overall performance of a data intensive application is strongly affected by the throughput of the messaging middleware since it is required to transfer data in a map task and a reduce task. However the performance of computational intensive application is associated with CPU throughput. We have investigated the performance of these MapReduce applications on Future Grid and have done detailed performance variation studies. The results of this experiment can be used for selecting the proper configuration instances in the FutureGrid. It can be used to identify the bottleneck of the MapReduce application running on the virtualized cluster system with various VM configurations. We conclude that performance evaluation according to the type of specific application is essential to choose properly a set of instances in the FutureGrid.
I. Overview of experiment
A. Experiment Environment
In this experiment, a virtualized cluster system composed of a group of an instance is allocated from india cluster, which is one of FuturGrid environments. Each instance provides a predictable amount of dedicated compute capacity that is defined in FutureGrid. The following instance types are used to the experiments:· c1-medium
· m1-large
· m1-xlarge
We make a configuration for a virtualized cluster system as tested and use various configurations that are used to evaluate performance of two types of a MapReduce application. A configuration has various middleware setups. It is used to represent two different workloads. For example, sim-c1-ml represents an unbalanced load allocation and sim-2-ml represents a balanced load allocation.
The MapReduce application is implemented on a system using:
· Twister 0.8
· Naradabroker 4.2.2
· Linux 2.6.x running on Xen
Before diving into the MapReduce algorithm, we set up virtualized cluster systems of the cloud architecture. To set up the virtualized cluster systems, we deploy images and run the instances. We use a Linux command top that provides a dynamic real-time view of a running system, including information about system resource usage and a constantly updated list of the processes which are consuming the most resources. This can be one of the most useful ways to monitor the system as it shows several key statistics. We set the top command as batch mode, 1 sec. update and 1000 samples to monitor resource usage. By using a tool, top we get the trace of memory and load average while a MapReduce application is running in a specific VM environment.
B. Restrictions of the experiment
This experiment is a micro-level evaluation that is focused on the nodes provided and the application running on them.· The applications of which are used in the experiment follow a MapReduce programming model
· With regard to this experiment, resource allocation considers in a static way that means how to select computing resources to optimize a MapReduce application running on the nodes
· Performance evaluation is based on the samples, representing a system snapshot of the work system, collected from a command top while a MapReduce application is running
II. Experiment: Data intensive Application
In this experiment, two different computing environments are evaluated, which are running a data intensive application written in MapReduce programming modeling with various configurations: one is a cluster system composed of real machines and the other is a virtualized cluster computing system. For this work, we construct a MapReduce application is used to transforms a data set collected from a music radio site, Last.fm(http://www.last.fm/) that provide the metadata for an artist includes biography by API, on the Internet. The goal program is to histogram the counts referred by musicians and to construct a bi-directed graph based on similarity value between musicians in the data set.We compare both environments with application’s performance metrics in terms of elapse time and standard variation. The graph in Figure 1 deals with the results using the MapReduce application. In the part of the graph, sim-c1-m1-1 to type sim-2-ml, we see that as the resources of VMs including CPU and memory increase, the elapse time of the application and the value of its standard variation decreases. What we observe that the number of CPUs has less impact on the elapse time in comparison to the results of sim-c1-m1-2 and sim-2-m1. Though performance degrades as the application runs in the virtualization environment, the performance of sim-2-ml still provides 80.9% of the average performance of sim-gf14-fg15 and sim-india when running the real computing environment. However the elapse time of type sim-2-ml is 98.6 % of the elapse time of sim-fg14-fg15.

Figure 1. Elapse time of similarity: 6 configurations - Cluster system(3 types) and Virtualized cluster system(2 types)
Figures 2 and 3 show the load averages as the program runs on different middleware configurations even if those computing resources have the same configuration computing resource that consists of 1 c1-medium and 1 m1-large. We consider two middleware configurations: one is the message broker is run in the node (194) typed with c1-medim. Other is run in the node (196) type m1-medim. As shown in Figures 2 and 3, the overall workload of sim-c1-ml-2 is less than one of sim-c1-m1-2. In sim-c1-m1-1, the average number of running processes is 3.24 and its maximum number of running process is 4.97. The figure 2 shows the node has been overloaded 224% during the application running time. On the other hand, the average number of running processes is 0.80 and its maximum number of running process is 4.97 in sim-c1-m1-2. During the running time (342sec), the CPU was underloaded 20%.
According to this result, performance of a virtualized cluster system is affected by the middleware configuration depends on the location of the message broker that send and receive the message to/from application. The gap of performance is caused by CPU and memory capability of the node running the message broker. What we have observed is that the application is more I/O oriented job that needs more memory than CPU power. We can expect more high throughput when the node typed with c1-medium may be replaced with other node typed with m1-large.

Figure 2. Load average of sim-c1-m1-1(NB running on the node typed with c1-medium)
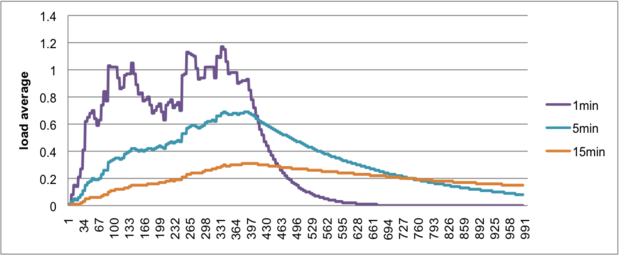
Figure 3. Load average of sim-c1-m1-2(NB running on the node typed with m1-medium)
III. Experiment: Computation intensive application
To do performance evaluation of a MapReduce application typed computation intensive, one configuration, xlarge, is added to the testbed. In this experiment, we use k-means algorithm with 100,000 data points, which is to organize these points into k clusters. We compare both environments, a virtual cluster computing system and a cluster system, with application’s performance metrics in terms of elapse time and standard variation. Figure 4 shows the elapse time of k-means. Our experiment indicates that the average elapse time can increase by over 375.5% in virtualized cluster computing system, in comparison with cluster system, india. Besides the elapse time decreases proportional as VM’s CPU capability is added to the virtualized cluster computing system. Furthermore the standard deviation is less affected by configuration change and the size of input data. In the real cluster system, the value remains very low at about 1-2% of the variation of elapse time due to the capability of system mainly related with CPU power. In addition, the standard variation in the three configurations of the virtualized cluster computing system remains low at about 2.0-3.78%. A similar trend is observed by in the values of standard deviation of all configurations. Hence we can expect that as the number of available VMs increases, there is a proportional improvement of elapse time.

Figure 4. Elapse time of k-means: 6 configurations - Cluster system(4 types) and Virtualized cluster system(1 types)
IV. Summary of the experiments
In summary, performance evaluation based on the metrics, load average and memory/swap area usage, according to the type of specific application is essential to choose properly a set of instances in the FutureGrid. Based on the performance evaluation we may choose the configuration of a virtualized cluster system to provide 80% of performance of a real cluster system.· The performance of the application running on the Twister strongly depends on the throughput of a message broker, Naradabroker.
· The pending of the application is caused by broken pipe between a Twister daemon and a Naradabroker server when Naradabroker has a threshold of the limitation to accept a connection from Twister due to its QoS requirement.
· The capability of Naradabroker in the middleware configuration affects the performance of an application as the application runs in the same configuration computing resource.