|
|
FutureGrid Cloud Metric |
|
|
FutureGrid Cloud Metric |
Period: July 01 – July 31, 2013
Cloud(IaaS): nimbus, openstack
Hostname: alamo
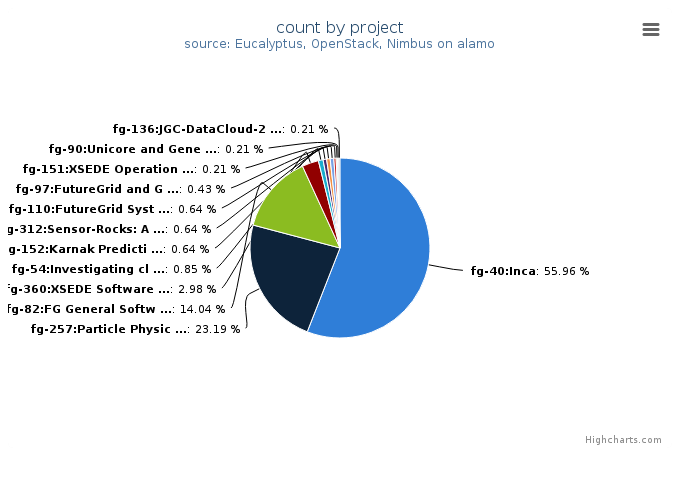
| Project | Value |
|---|---|
| fg-40:Inca | 263 |
| fg-257:Particle Physics Data analysis cluster for ATLAS LHC experiment | 109 |
| fg-82:FG General Software Development | 66 |
| fg-360:XSEDE Software Development and Integration Testing | 14 |
| fg-54:Investigating cloud computing as a solution for analyzing particle physics data | 4 |
| fg-152:Karnak Prediction Service | 3 |
| fg-312:Sensor-Rocks: A novel integrated framework to improve software Operations and Management (O&M) and power management in environmental observing systems | 3 |
| fg-110:FutureGrid Systems Development | 3 |
| fg-97:FutureGrid and Grid‘5000 Collaboration | 2 |
| fg-151:XSEDE Operations Group | 1 |
| fg-90:Unicore and Genesis Experimentation | 1 |
| fg-136:JGC-DataCloud-2012 paper experiments | 1 |
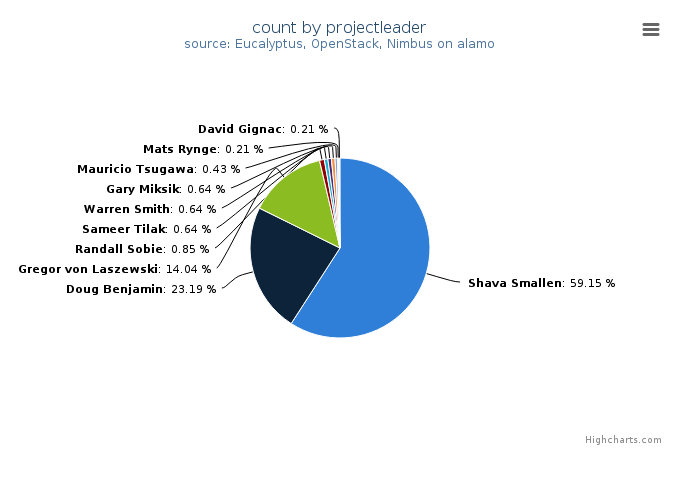
| Projectleader | Value |
|---|---|
| Shava Smallen | 278 |
| Doug Benjamin | 109 |
| Gregor von Laszewski | 66 |
| Randall Sobie | 4 |
| Sameer Tilak | 3 |
| Warren Smith | 3 |
| Gary Miksik | 3 |
| Mauricio Tsugawa | 2 |
| Mats Rynge | 1 |
| David Gignac | 1 |
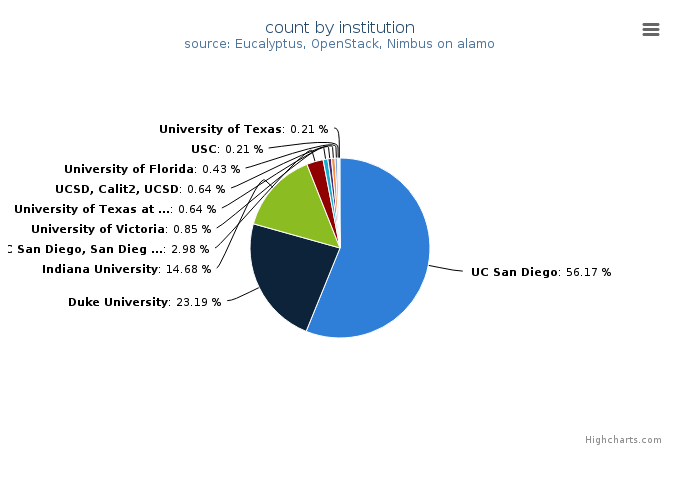
| Institution | Value |
|---|---|
| UC San Diego | 264 |
| Duke University | 109 |
| Indiana University | 69 |
| UC San Diego, San Diego Supercomputer Center | 14 |
| University of Victoria | 4 |
| University of Texas at Austin | 3 |
| UCSD, Calit2, UCSD | 3 |
| University of Florida | 2 |
| USC | 1 |
| University of Texas | 1 |
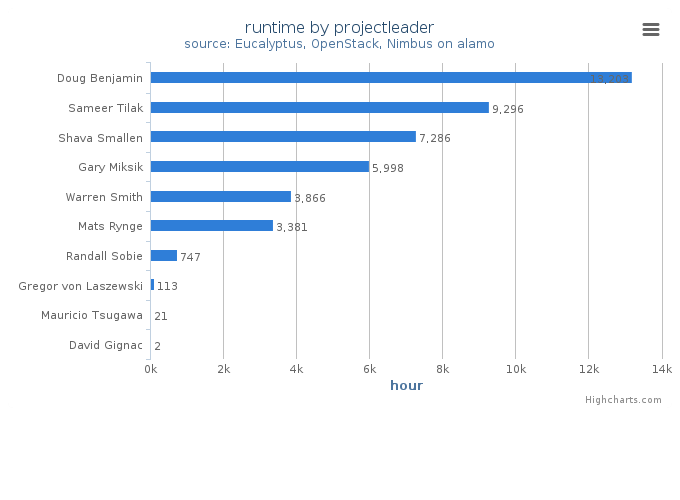
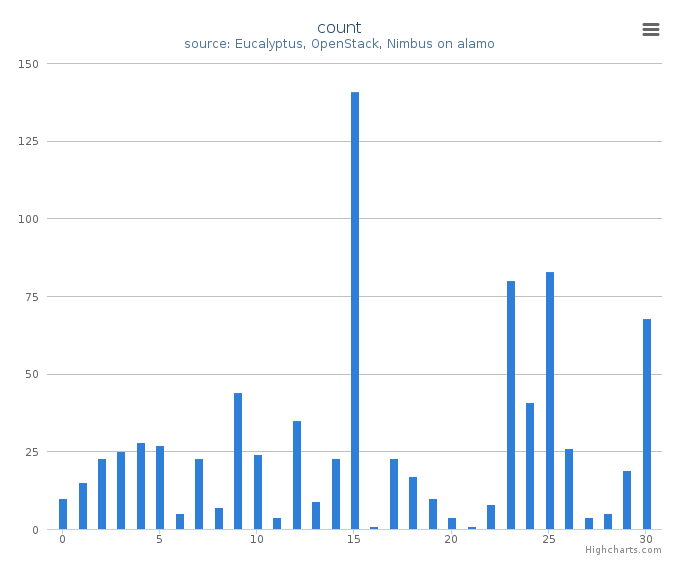
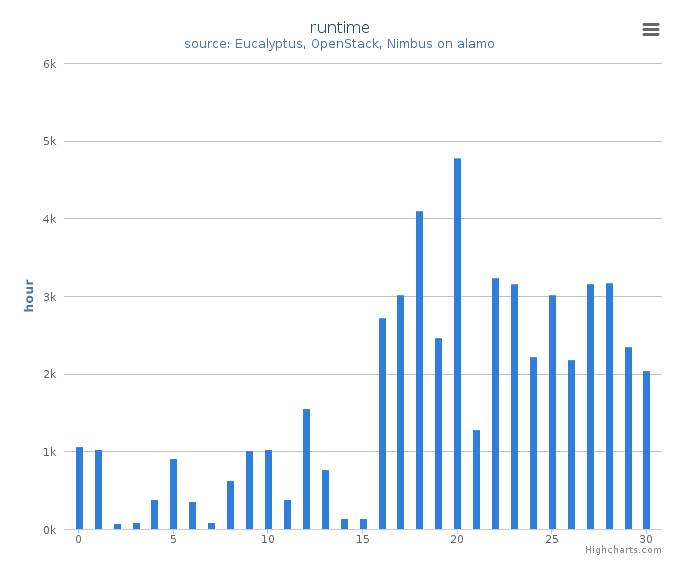
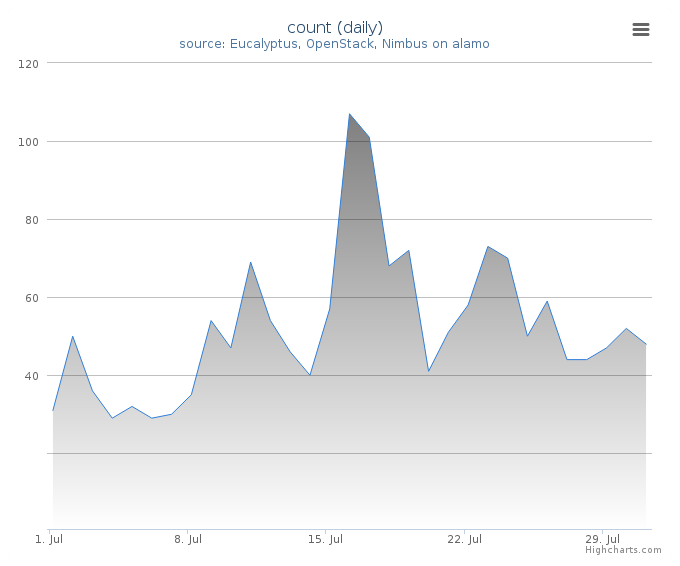
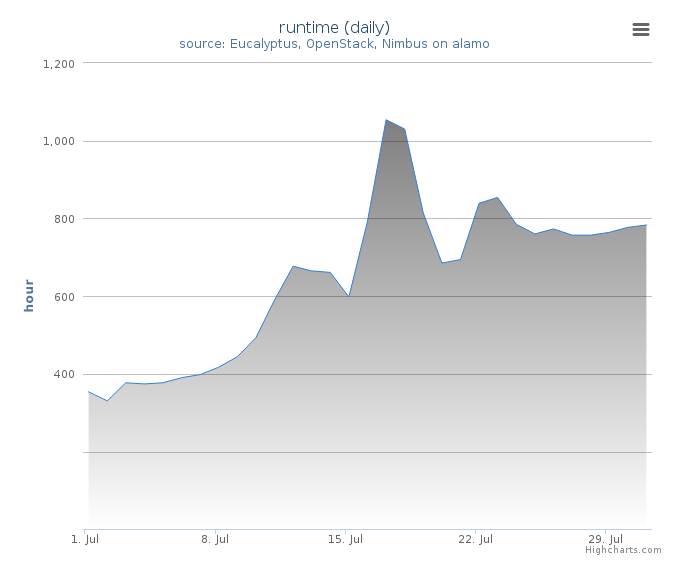
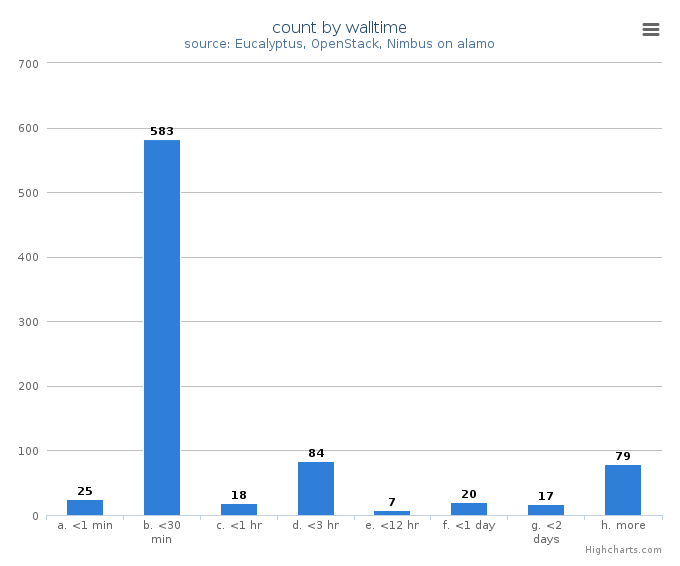
System information shows utilization distribution as to VMs count and wall time. Each cluster represents a compute node.