|
|
FutureGrid Cloud Metric |
|
|
FutureGrid Cloud Metric |
Period: July 01 – July 31, 2013
Cloud(IaaS): nimbus
Hostname: hotel
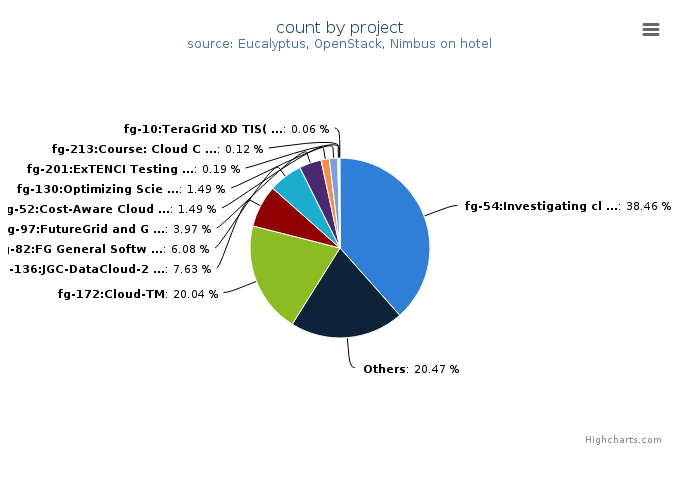
| Project | Value |
|---|---|
| fg-54:Investigating cloud computing as a solution for analyzing particle physics data | 620 |
| Others | 330 |
| fg-172:Cloud-TM | 323 |
| fg-136:JGC-DataCloud-2012 paper experiments | 123 |
| fg-82:FG General Software Development | 98 |
| fg-97:FutureGrid and Grid‘5000 Collaboration | 64 |
| fg-52:Cost-Aware Cloud Computing | 24 |
| fg-130:Optimizing Scientific Workflows on Clouds | 24 |
| fg-201:ExTENCI Testing, Validation, and Performance | 3 |
| fg-213:Course: Cloud Computing class - second edition | 2 |
| fg-10:TeraGrid XD TIS(Technology Insertion Service) Technology Evaluation Laboratory | 1 |
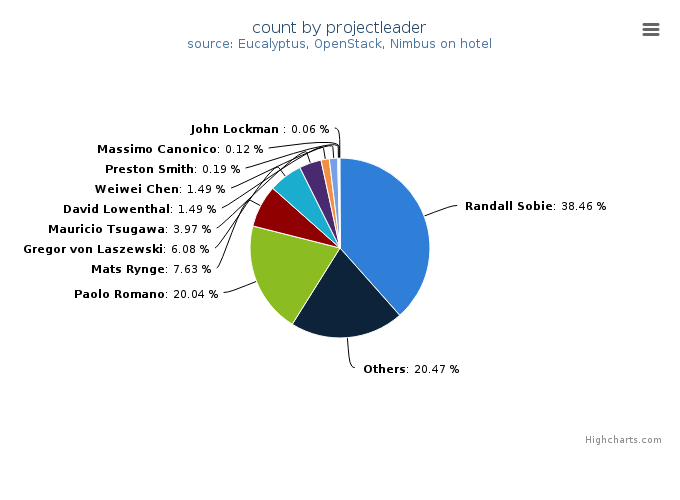
| Projectleader | Value |
|---|---|
| Randall Sobie | 620 |
| Others | 330 |
| Paolo Romano | 323 |
| Mats Rynge | 123 |
| Gregor von Laszewski | 98 |
| Mauricio Tsugawa | 64 |
| David Lowenthal | 24 |
| Weiwei Chen | 24 |
| Preston Smith | 3 |
| Massimo Canonico | 2 |
| John Lockman | 1 |

| Institution | Value |
|---|---|
| University of Victoria | 620 |
| Others | 330 |
| INESC ID | 323 |
| USC | 123 |
| Indiana University | 98 |
| University of Florida | 64 |
| University of Southern California | 24 |
| University of Arizona | 24 |
| Purdue University | 3 |
| University of Piemonte Orientale | 2 |
| University of Texas at Austin | 1 |
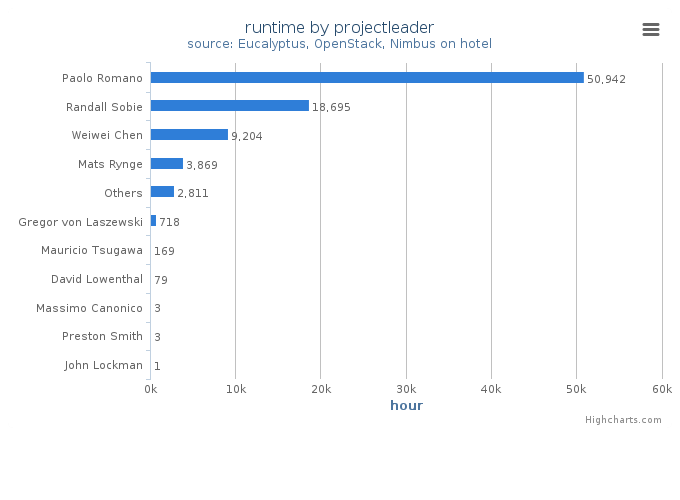
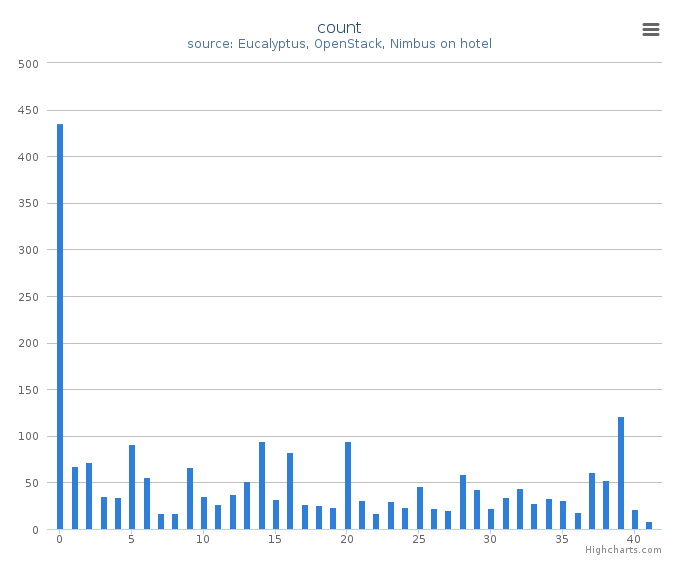
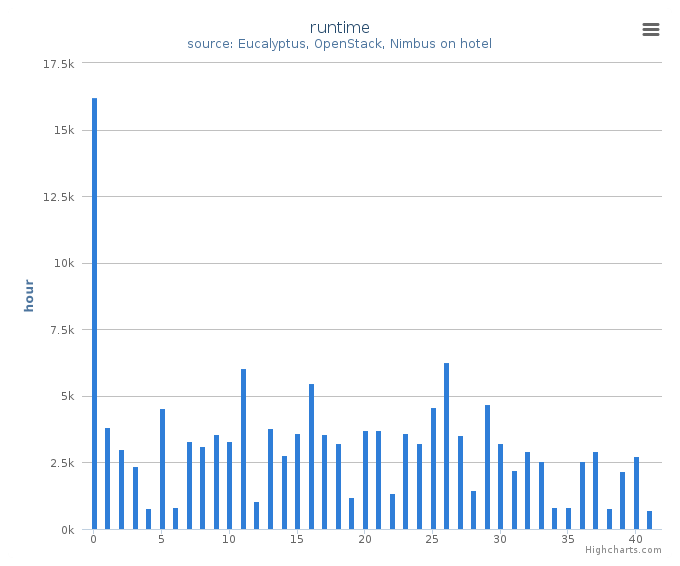
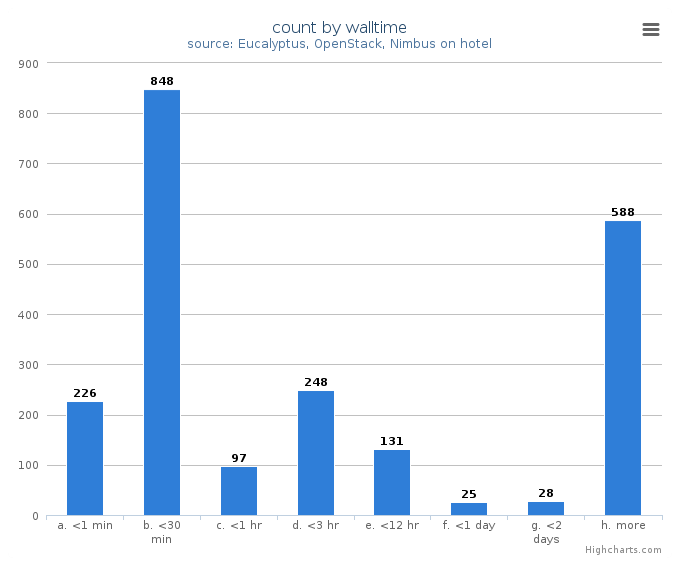
System information shows utilization distribution as to VMs count and wall time. Each cluster represents a compute node.