|
|
FutureGrid Cloud Metric |
|
|
FutureGrid Cloud Metric |
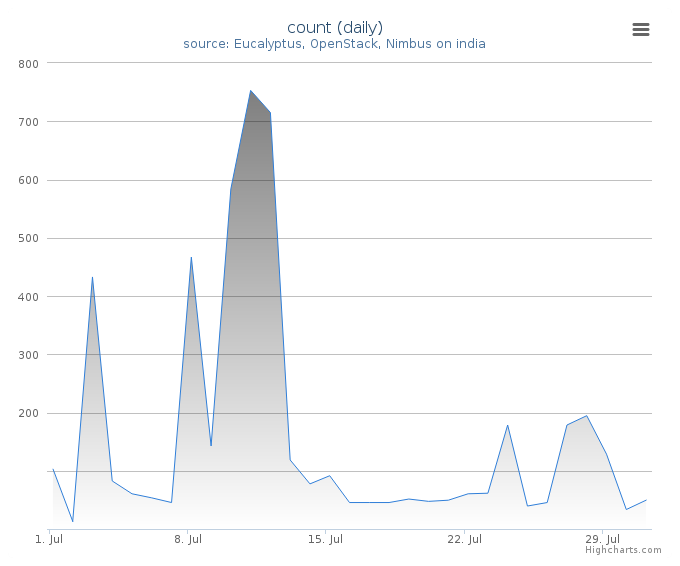
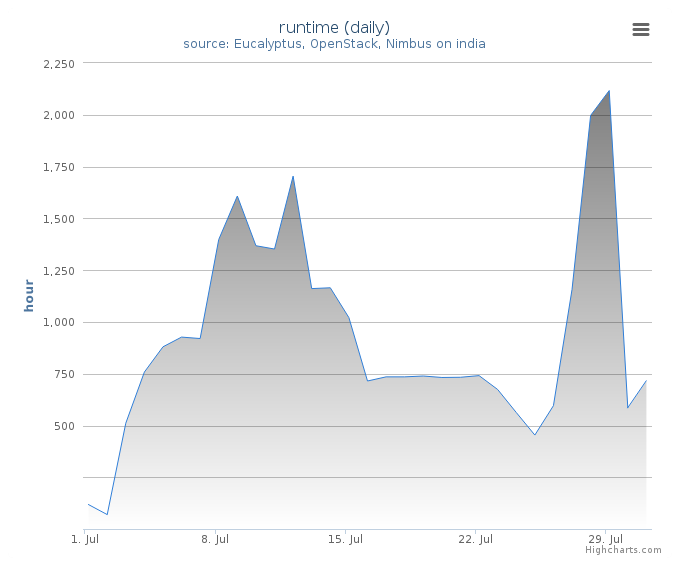
Period: July 01 – July 31, 2013
Cloud(IaaS): openstack, eucalyptus
Hostname: india
| Project | Value |
|---|---|
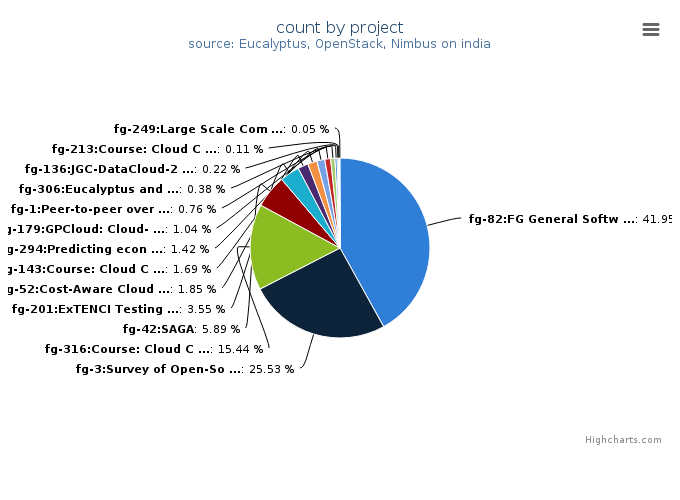
| fg-82:FG General Software Development | 769 |
| fg-3:Survey of Open-Source Cloud Infrastructure using FutureGrid Testbed | 468 |
| fg-316:Course: Cloud Computing Class - third edition | 283 |
| fg-42:SAGA | 108 |
| fg-201:ExTENCI Testing, Validation, and Performance | 65 |
| fg-52:Cost-Aware Cloud Computing | 34 |
| fg-143:Course: Cloud Computing for Data Intensive Science Class | 31 |
| fg-294:Predicting economic activities using social media | 26 |
| fg-179:GPCloud: Cloud-based Automatic Repair of Real-World Software Bugs | 19 |
| fg-1:Peer-to-peer overlay networks and applications in virtual networks and virtual clusters | 14 |
| fg-306:Eucalyptus and Openstack | 7 |
| fg-136:JGC-DataCloud-2012 paper experiments | 4 |
| fg-213:Course: Cloud Computing class - second edition | 2 |
| fg-253:Characterizing Performance of Infrastructure Clouds | 1 |
| fg-97:FutureGrid and Grid‘5000 Collaboration | 1 |
| fg-249:Large Scale Computing Infrastructure 2012 Master class | 1 |
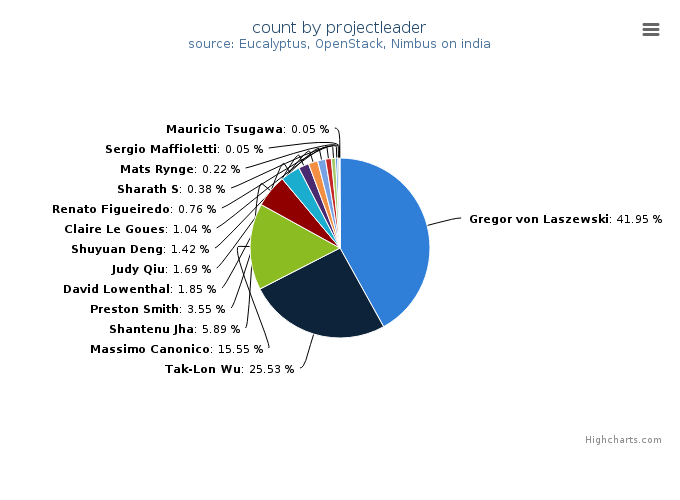
| Projectleader | Value |
|---|---|
| Gregor von Laszewski | 769 |
| Tak-Lon Wu | 468 |
| Massimo Canonico | 285 |
| Shantenu Jha | 108 |
| Preston Smith | 65 |
| David Lowenthal | 34 |
| Judy Qiu | 31 |
| Shuyuan Deng | 26 |
| Claire Le Goues | 19 |
| Renato Figueiredo | 14 |
| Sharath S | 7 |
| Mats Rynge | 4 |
| Paul Marshall | 1 |
| Sergio Maffioletti | 1 |
| Mauricio Tsugawa | 1 |
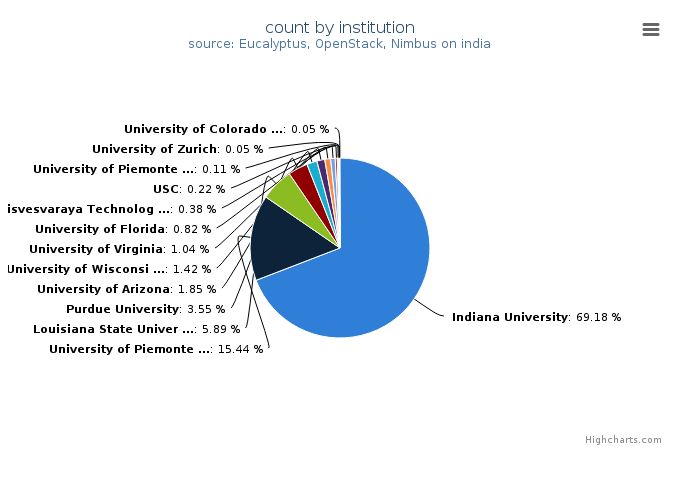
| Institution | Value |
|---|---|
| Indiana University | 1268 |
| University of Piemonte Orientale, Computer Science Department | 283 |
| Louisiana State University | 108 |
| Purdue University | 65 |
| University of Arizona | 34 |
| University of Wisconsin -Milwaukee | 26 |
| University of Virginia | 19 |
| University of Florida | 15 |
| Visvesvaraya Technological University, Computer science organiza | 7 |
| USC | 4 |
| University of Piemonte Orientale | 2 |
| University of Zurich | 1 |
| University of Colorado at Boulder | 1 |
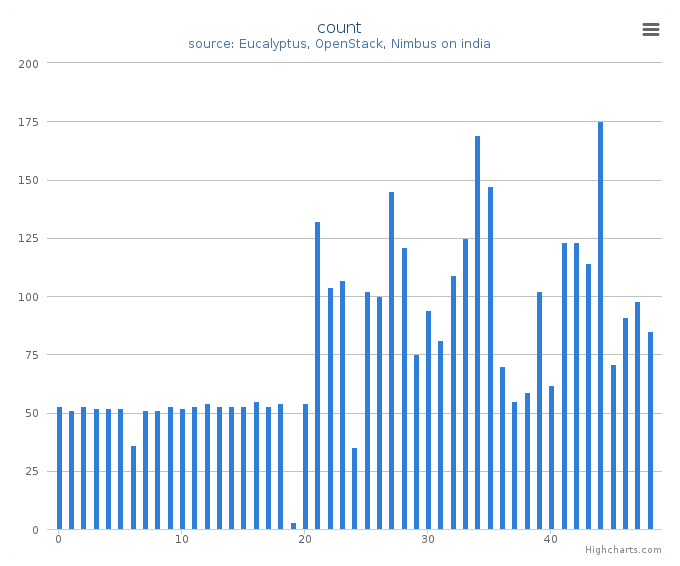
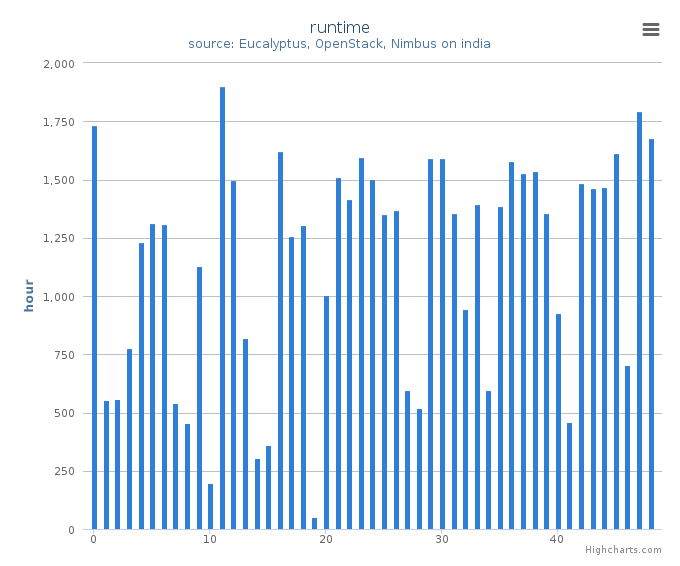
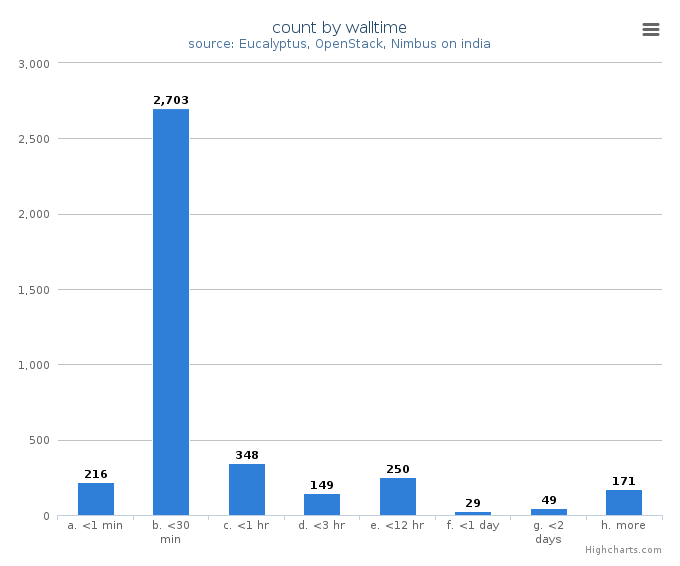
System information shows utilization distribution as to VMs count and wall time. Each cluster represents a compute node.