|
|
FutureGrid Cloud Metric |
|
|
FutureGrid Cloud Metric |
Period: August 01 – August 31, 2013
Cloud(IaaS): openstack, eucalyptus
Hostname: india
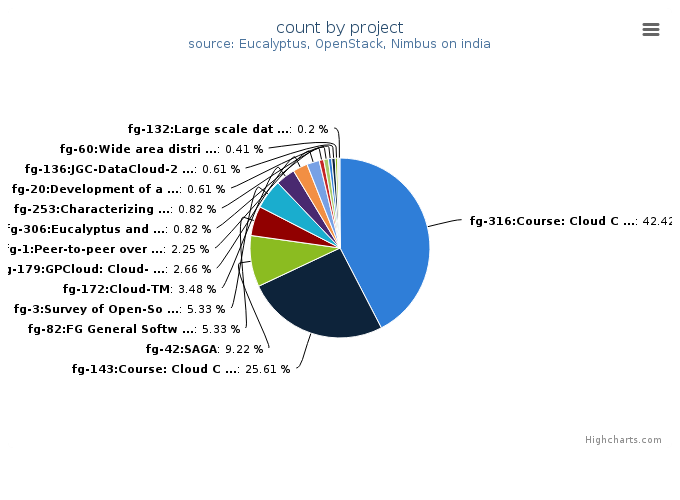
| Project | Value |
|---|---|
| fg-316:Course: Cloud Computing Class - third edition | 207 |
| fg-143:Course: Cloud Computing for Data Intensive Science Class | 125 |
| fg-42:SAGA | 45 |
| fg-82:FG General Software Development | 26 |
| fg-3:Survey of Open-Source Cloud Infrastructure using FutureGrid Testbed | 26 |
| fg-172:Cloud-TM | 17 |
| fg-179:GPCloud: Cloud-based Automatic Repair of Real-World Software Bugs | 13 |
| fg-1:Peer-to-peer overlay networks and applications in virtual networks and virtual clusters | 11 |
| fg-306:Eucalyptus and Openstack | 4 |
| fg-253:Characterizing Performance of Infrastructure Clouds | 4 |
| fg-20:Development of an information service for FutureGrid | 3 |
| fg-136:JGC-DataCloud-2012 paper experiments | 3 |
| fg-60:Wide area distributed file system for MapReduce applications on FutureGrid platform | 2 |
| fg-201:ExTENCI Testing, Validation, and Performance | 1 |
| fg-132:Large scale data analytics | 1 |
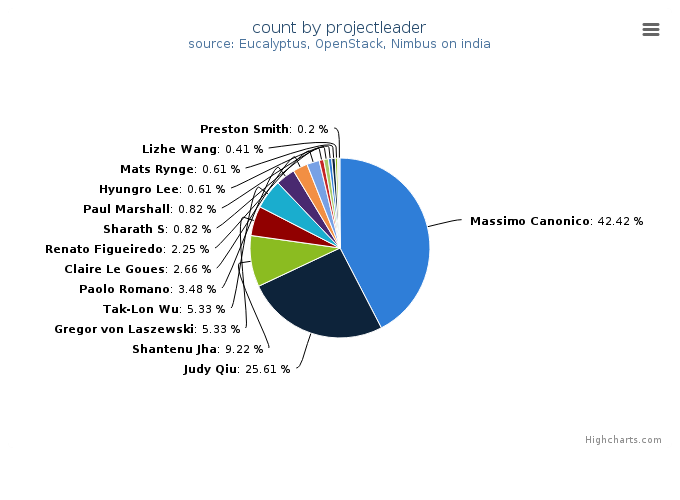
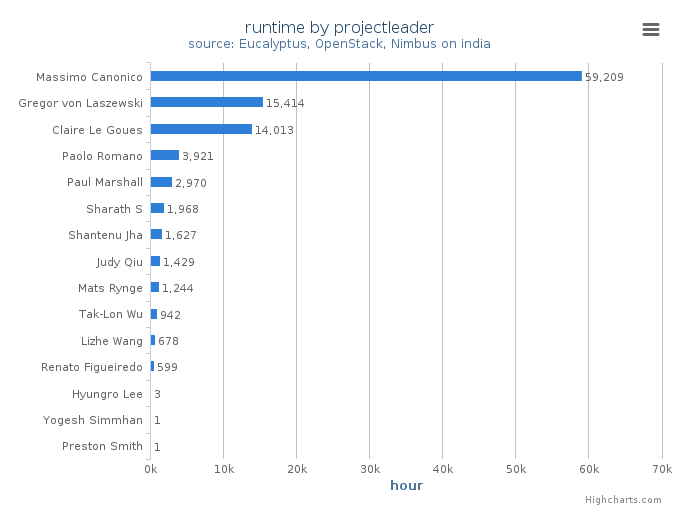
| Projectleader | Value |
|---|---|
| Massimo Canonico | 207 |
| Judy Qiu | 125 |
| Shantenu Jha | 45 |
| Gregor von Laszewski | 26 |
| Tak-Lon Wu | 26 |
| Paolo Romano | 17 |
| Claire Le Goues | 13 |
| Renato Figueiredo | 11 |
| Sharath S | 4 |
| Paul Marshall | 4 |
| Hyungro Lee | 3 |
| Mats Rynge | 3 |
| Lizhe Wang | 2 |
| Yogesh Simmhan | 1 |
| Preston Smith | 1 |
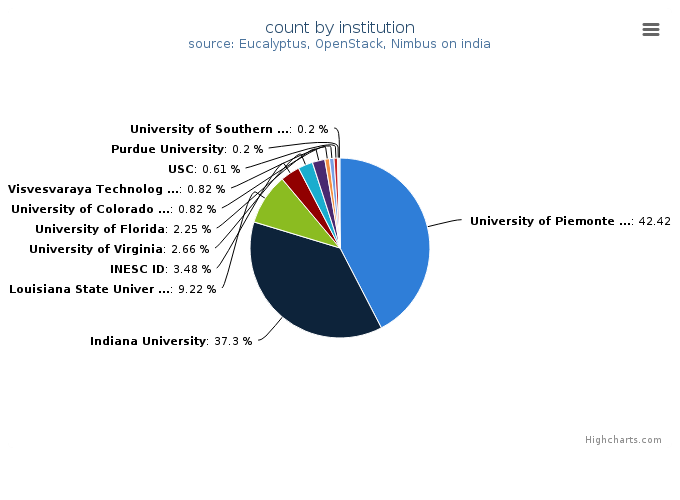
| Institution | Value |
|---|---|
| University of Piemonte Orientale, Computer Science Department | 207 |
| Indiana University | 182 |
| Louisiana State University | 45 |
| INESC ID | 17 |
| University of Virginia | 13 |
| University of Florida | 11 |
| University of Colorado at Boulder | 4 |
| Visvesvaraya Technological University, Computer science organiza | 4 |
| USC | 3 |
| Purdue University | 1 |
| University of Southern California | 1 |
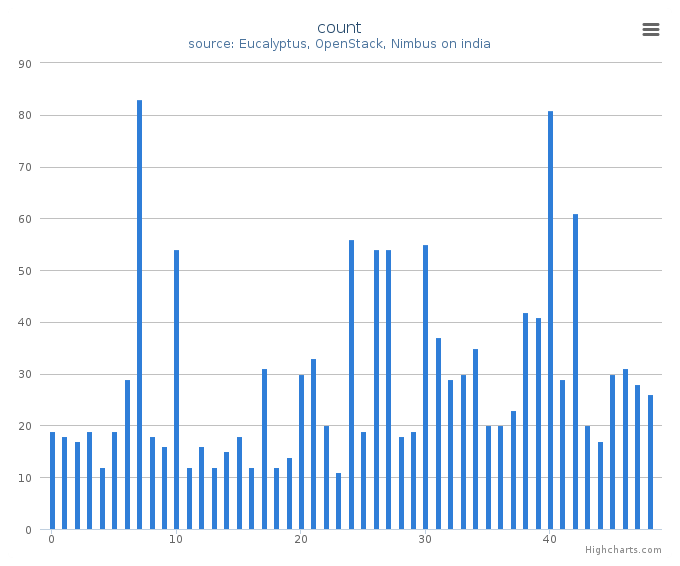
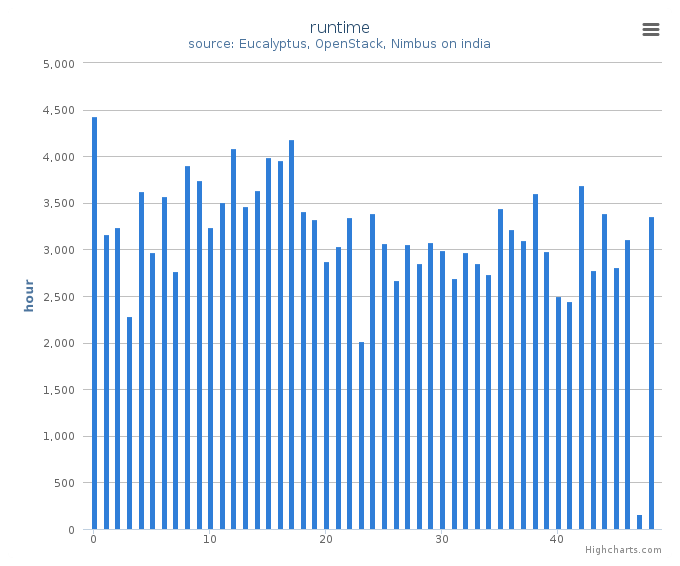
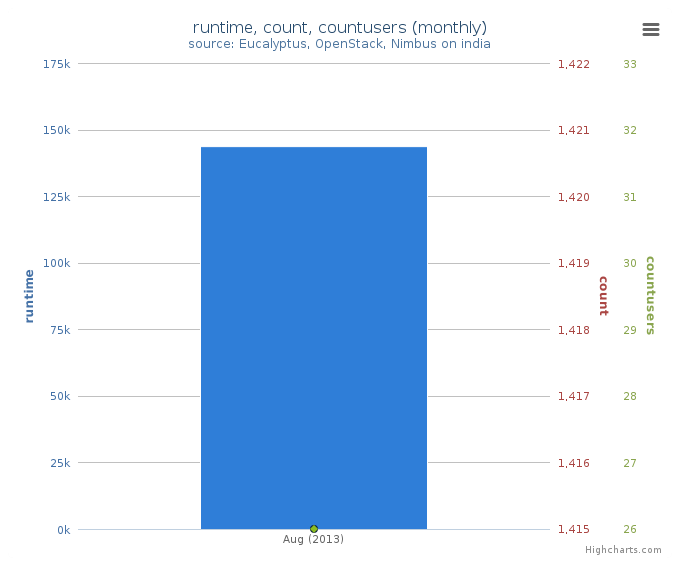
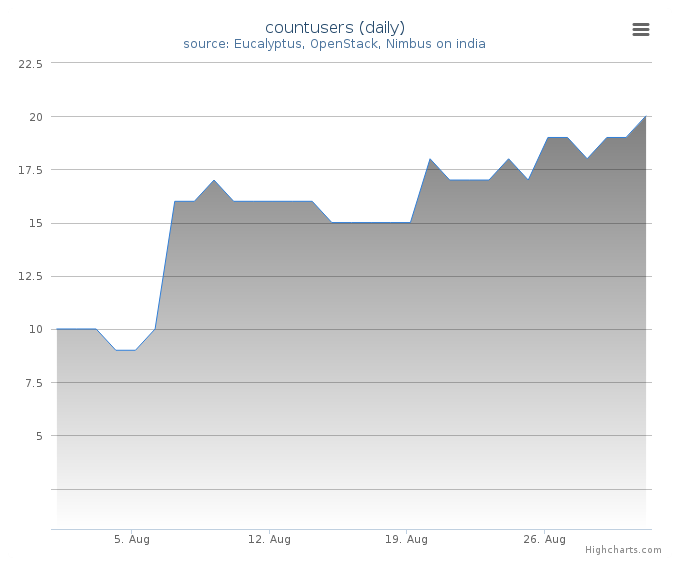
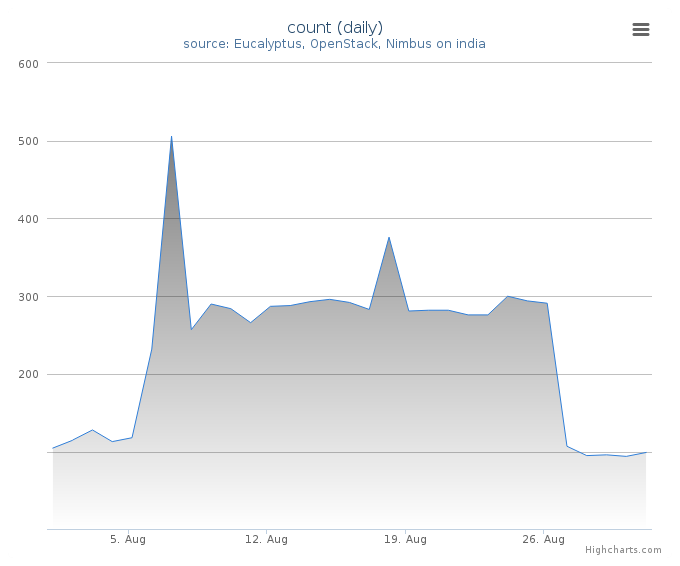
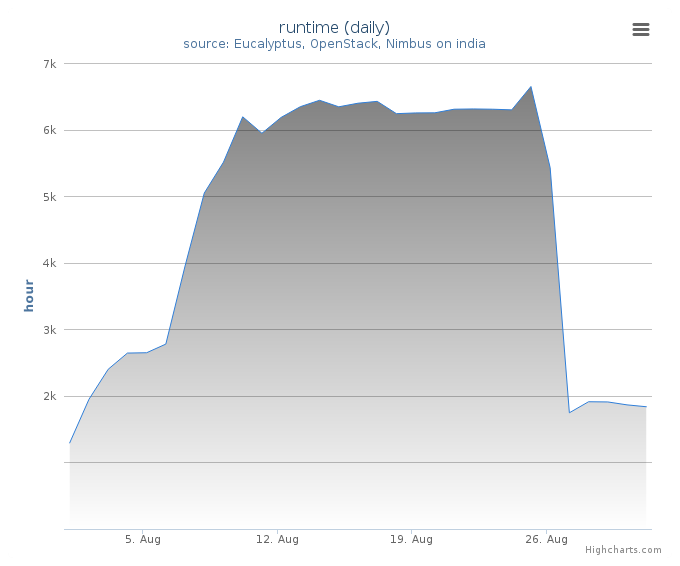
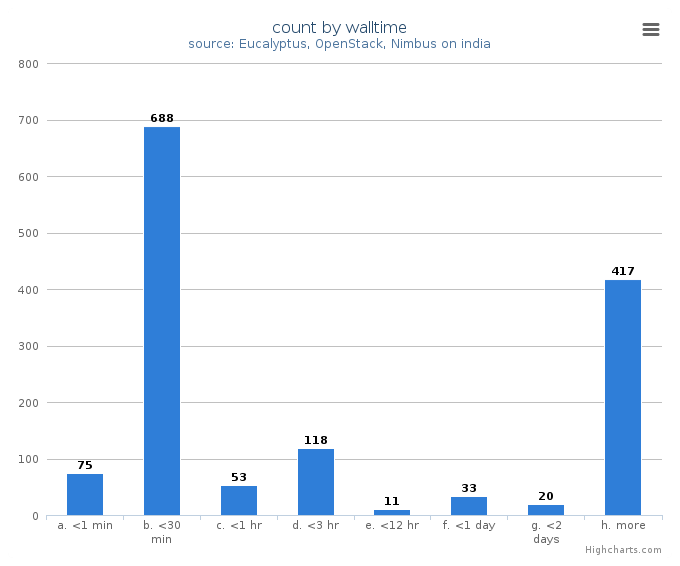
System information shows utilization distribution as to VMs count and wall time. Each cluster represents a compute node.