|
|
FutureGrid Cloud Metric |
|
|
FutureGrid Cloud Metric |
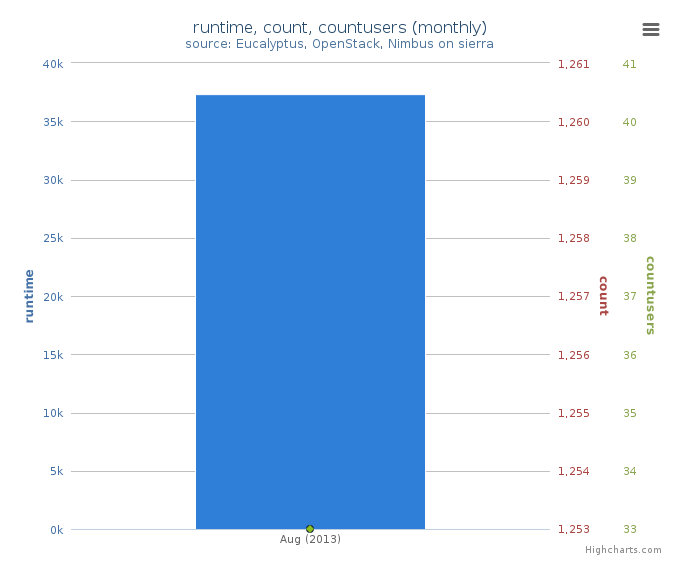
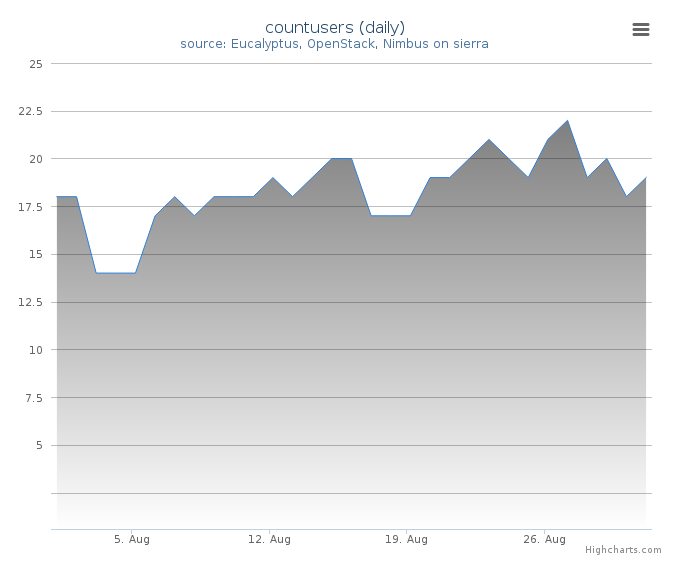
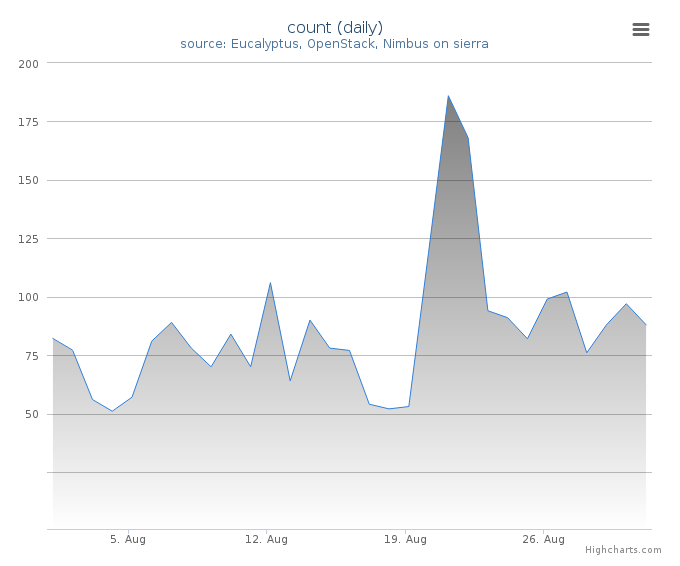
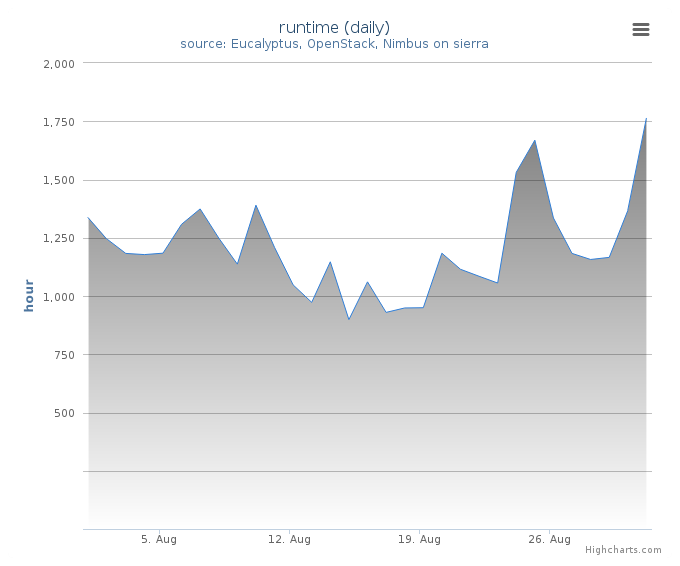
Period: August 01 – August 31, 2013
Cloud(IaaS): nimbus, openstack, eucalyptus
Hostname: sierra
| Project | Value |
|---|---|
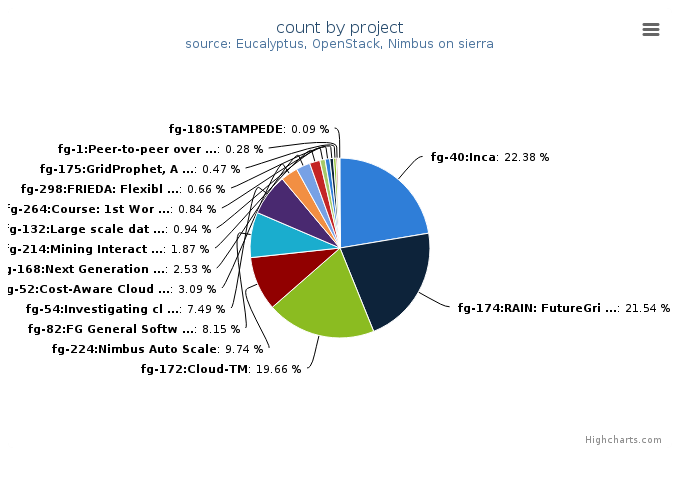
| fg-40:Inca | 239 |
| fg-174:RAIN: FutureGrid Dynamic provisioning Framework | 230 |
| fg-172:Cloud-TM | 210 |
| fg-224:Nimbus Auto Scale | 104 |
| fg-82:FG General Software Development | 87 |
| fg-54:Investigating cloud computing as a solution for analyzing particle physics data | 80 |
| fg-52:Cost-Aware Cloud Computing | 33 |
| fg-168:Next Generation Sequencing in the Cloud | 27 |
| fg-214:Mining Interactions between Network Community Structure and Information Diffusion | 20 |
| fg-132:Large scale data analytics | 10 |
| fg-264:Course: 1st Workshop on bioKepler Tools and Its Applications | 9 |
| fg-298:FRIEDA: Flexible Robust Intelligent Elastic Data Management | 7 |
| fg-175:GridProphet, A workflow execution time prediction system for the Grid | 5 |
| fg-1:Peer-to-peer overlay networks and applications in virtual networks and virtual clusters | 3 |
| fg-244:Course: Data Center Scale Computing | 1 |
| fg-356:IPython pipelines for training life sciences researchers on NGS data analysis | 1 |
| fg-69:Investigate provenance collection for MapReduce | 1 |
| fg-180:STAMPEDE | 1 |
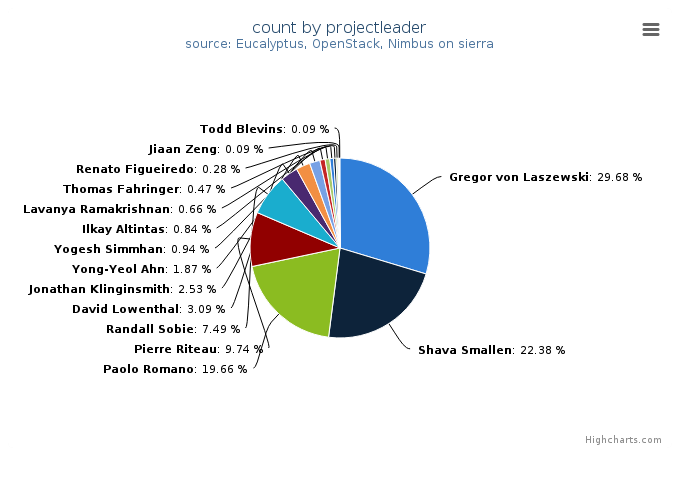
| Projectleader | Value |
|---|---|
| Gregor von Laszewski | 317 |
| Shava Smallen | 239 |
| Paolo Romano | 210 |
| Pierre Riteau | 104 |
| Randall Sobie | 80 |
| David Lowenthal | 33 |
| Jonathan Klinginsmith | 27 |
| Yong-Yeol Ahn | 20 |
| Yogesh Simmhan | 10 |
| Ilkay Altintas | 9 |
| Lavanya Ramakrishnan | 7 |
| Thomas Fahringer | 5 |
| Renato Figueiredo | 3 |
| Dan Gunter | 1 |
| Dirk Grunwald | 1 |
| Jiaan Zeng | 1 |
| Todd Blevins | 1 |
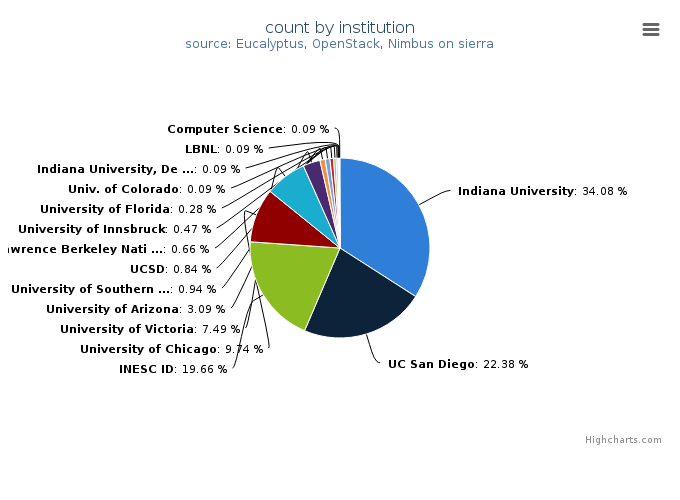
| Institution | Value |
|---|---|
| Indiana University | 364 |
| UC San Diego | 239 |
| INESC ID | 210 |
| University of Chicago | 104 |
| University of Victoria | 80 |
| University of Arizona | 33 |
| University of Southern California | 10 |
| UCSD | 9 |
| Lawrence Berkeley National Lab | 7 |
| University of Innsbruck | 5 |
| University of Florida | 3 |
| Univ. of Colorado | 1 |
| Indiana University, Depts of Biology and Molecular and Cellular | 1 |
| LBNL | 1 |
| Computer Science | 1 |
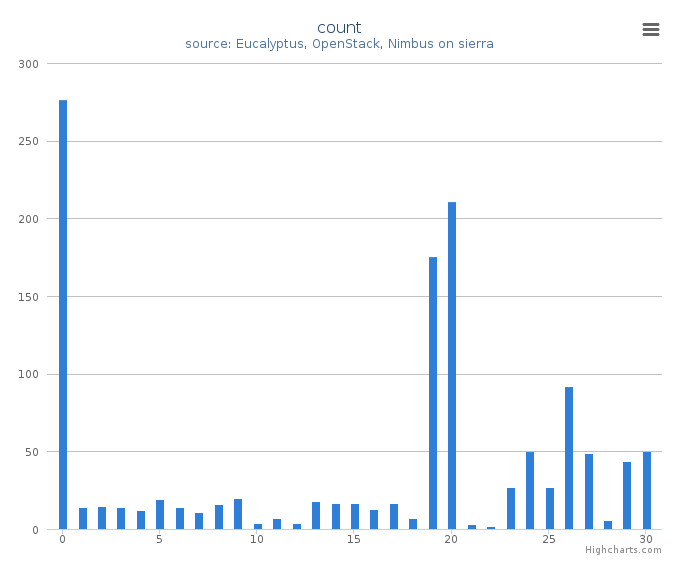
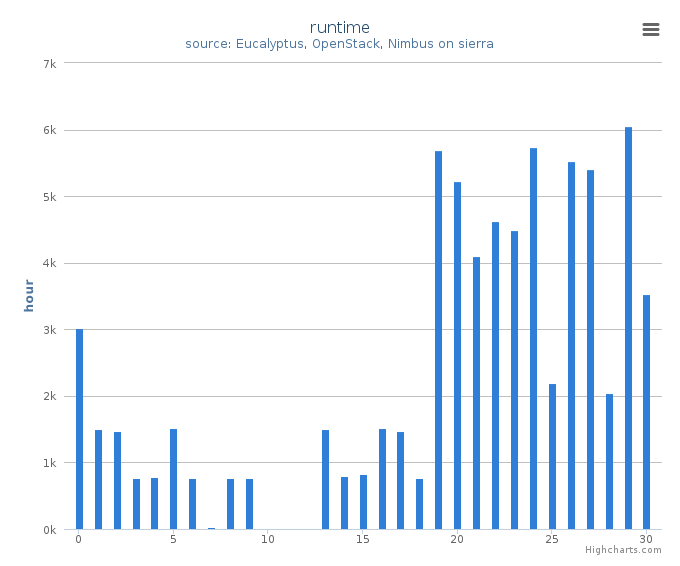
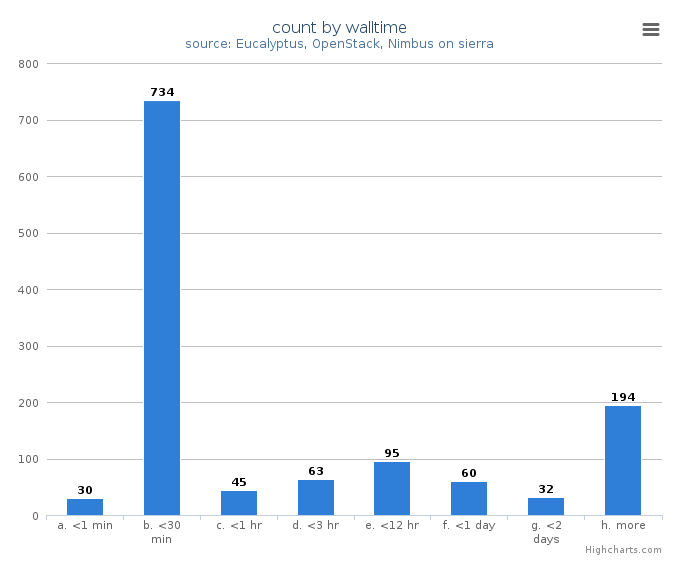
System information shows utilization distribution as to VMs count and wall time. Each cluster represents a compute node.