FutureGrid Cloud Metric FutureGrid

Cloud Metric

Table Of Contents

Previous topic

Usage Report alamo

Next topic

November 2013

This Page

Usage Report foxtrot

  • Period: December 01 – December 23, 2013
  • Hostname: foxtrot.futuregrid.org
  • Services: nimbus
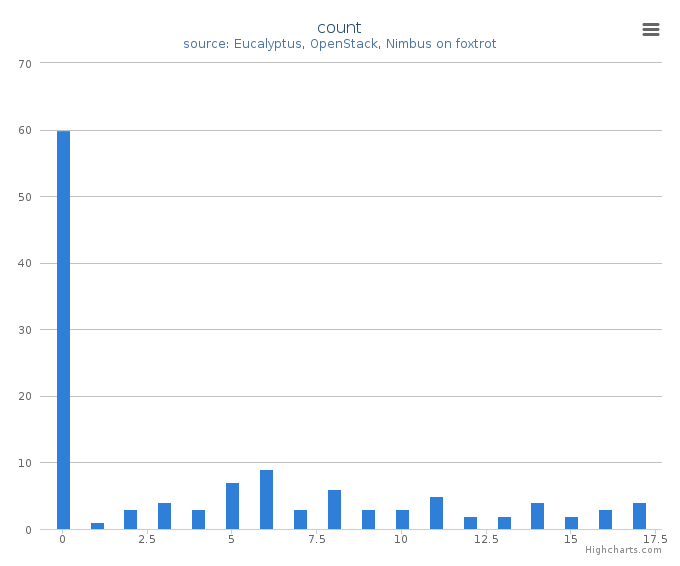
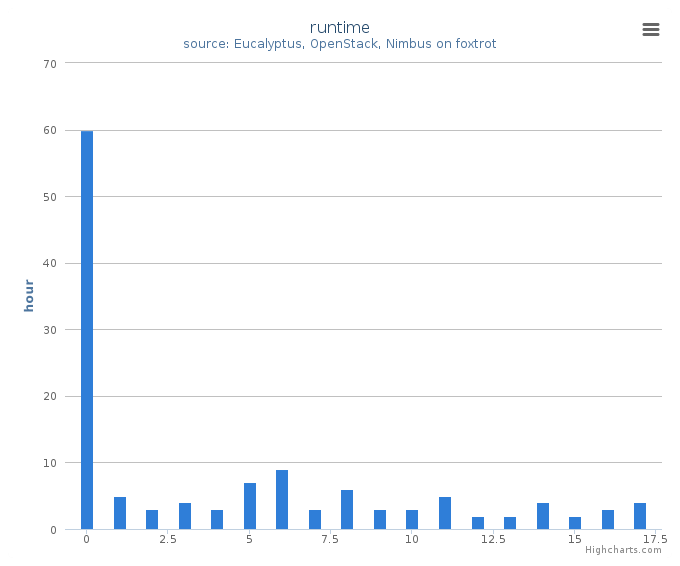
  • Metrics: VMs count, Users count, Wall time (hours), Distribution by wall time, project, project leader, and institution, and systems

Histogram

Summary (Monthly)

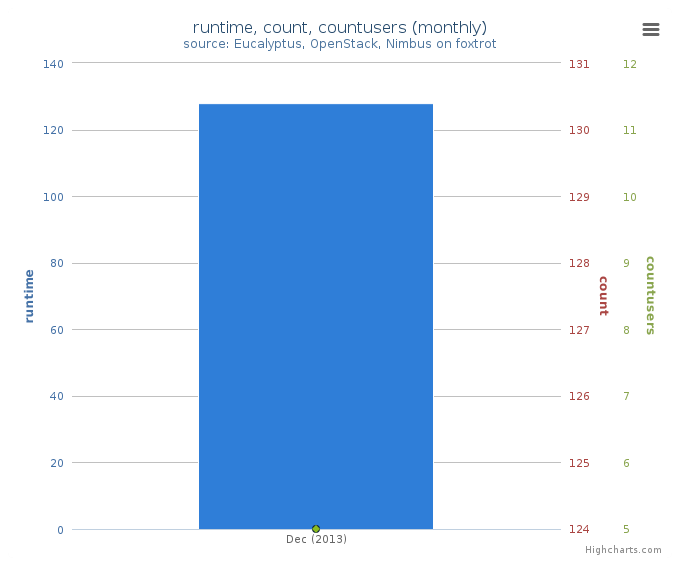
Average Monthly Usage Data (Wall time, Launched VMs, Users)
Figure 1: Average monthly usage data (wall time (hour), launched VMs, users)
This mixed chart represents average monthly usage as to wall time (hour), the number of VM instances and active users.
  • Period: December 01 – December 23, 2013

  • Cloud(IaaS): nimbus

  • Hostname: foxtrot

  • Metric:
    • Runtime (Wall time hours): Sum of time elapsed from launch to termination of VM instances
    • Count (VM count): The number of launched VM instances
    • User count (Active): The number of users who launched VMs

Summary (Daily)

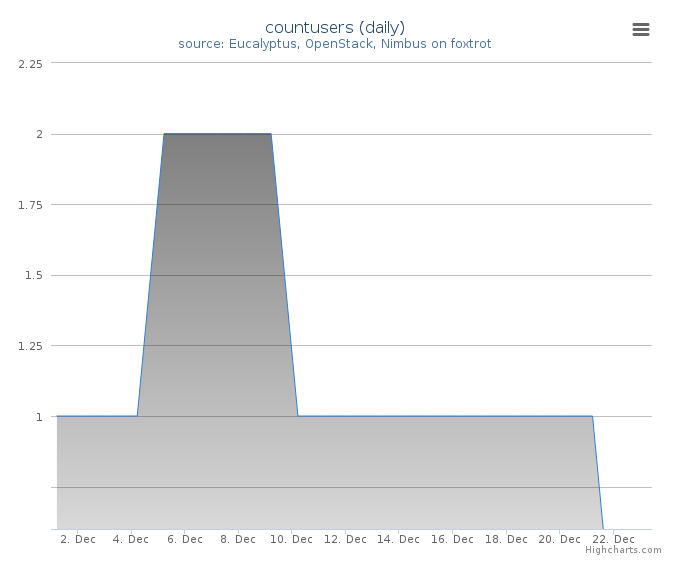
Users count (daily)
Figure 2: Users count
This time series chart represents daily active user count for cloud services and shows historical changes during the period.
  • Period: December 01 – December 23, 2013
  • Cloud(IaaS): nimbus
  • Hostname: foxtrot
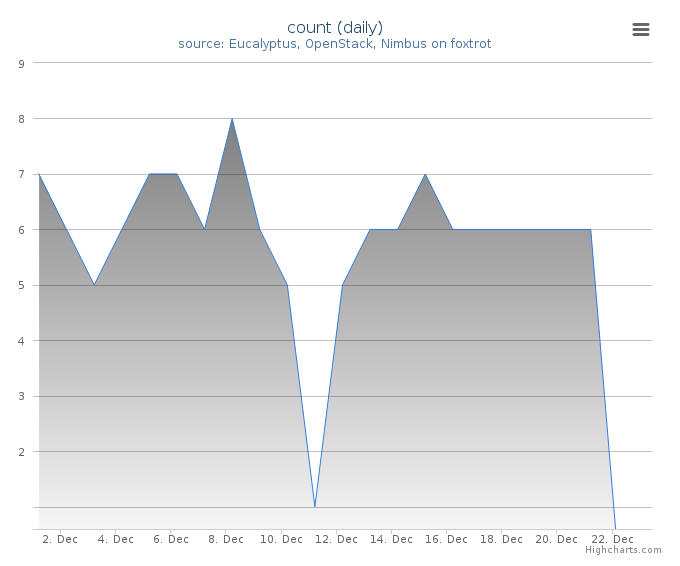
VMs count (daily)
Figure 3: VMs count
This time series chart represents the number of daily launched VM instances for cloud services and shows historical changes during the period.
  • Period: December 01 – December 23, 2013
  • Cloud(IaaS): nimbus
  • Hostname: foxtrot
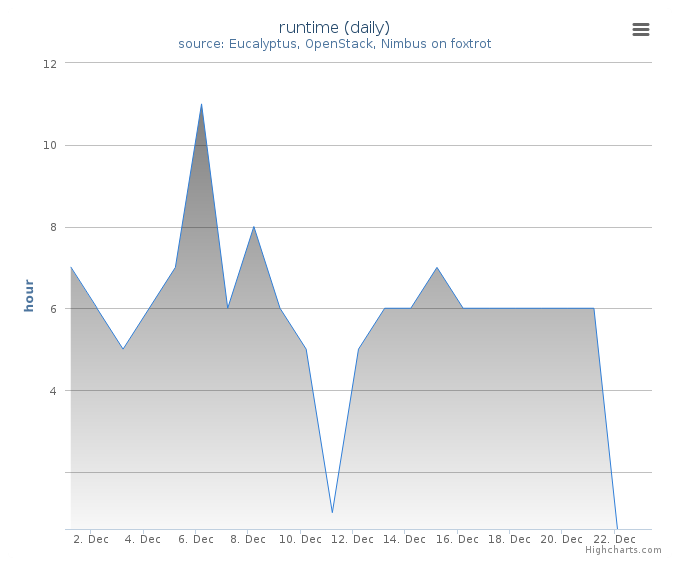
Wall time (hours, daily)
Figure 4: Wall time (hours)
This time series chart represents daily wall time (hours) for cloud services and shows historical changes during the period.
  • Period: December 01 – December 23, 2013
  • Cloud(IaaS): nimbus
  • Hostname: foxtrot

Distribution

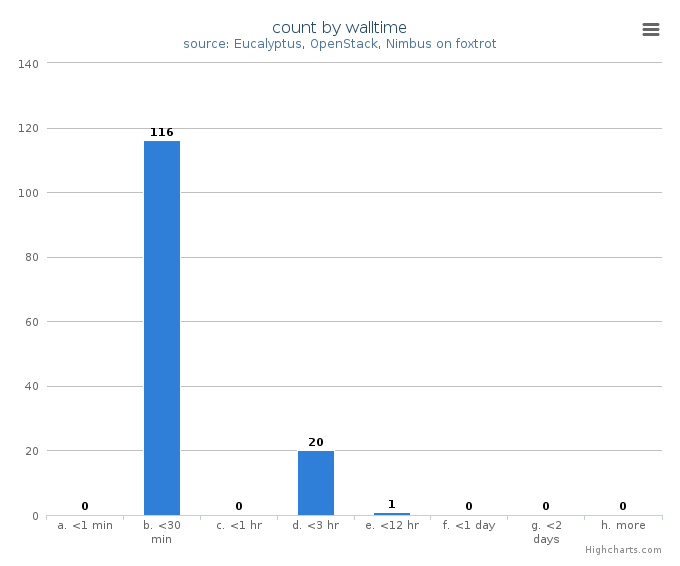
VM count by wall time
Figure 5: VM count by wall time
This chart illustrates usage patterns of VM instances in terms of running wall time.
  • Period: December 01 – December 23, 2013
  • Cloud(IaaS): nimbus
  • Hostname: foxtrot
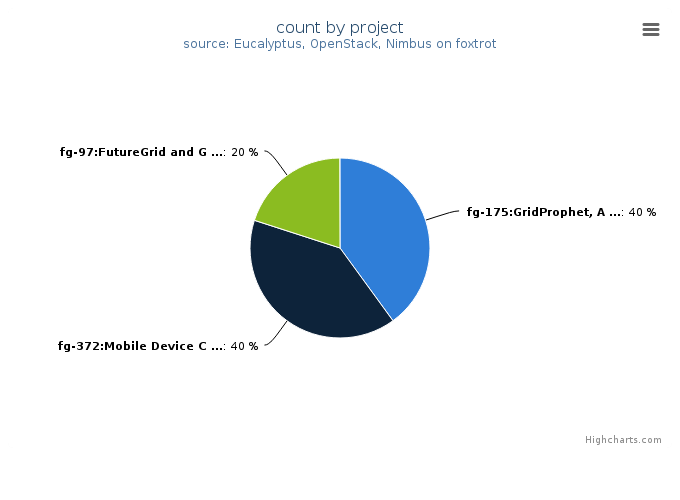
VMs count by project
Figure 6: VMs count by project
This chart illustrates the proportion of launched VM instances by project groups. The same data in tabular form follows.
  • Period: December 01 – December 23, 2013
  • Cloud(IaaS): nimbus
  • Hostname: foxtrot
VMs count by project
Project Value
fg-175:GridProphet, A workflow execution time prediction system for the Grid 2
fg-372:Mobile Device Computation Offloading over SocialVPNs 2
fg-97:FutureGrid and Grid‘5000 Collaboration 1
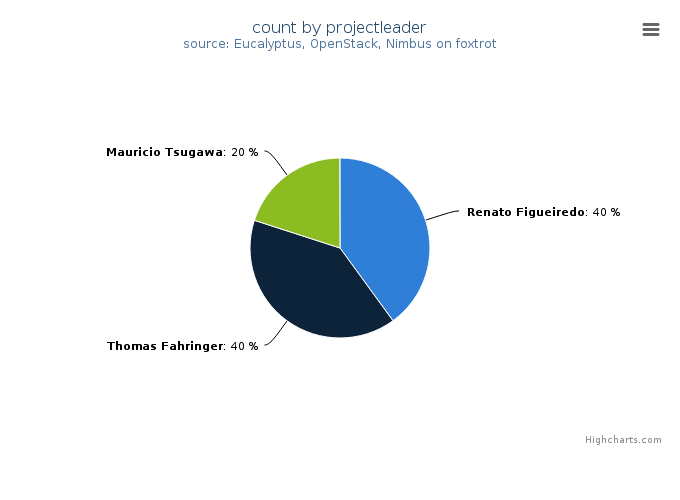
VMs count by project leader
Figure 7: VMs count by project leader
This chart also illustrates the proportion of launched VM instances by project Leader. The same data in tabular form follows.
  • Period: December 01 – December 23, 2013
  • Cloud(IaaS): nimbus
  • Hostname: foxtrot
VMs count by project leader
Projectleader Value
Renato Figueiredo 2
Thomas Fahringer 2
Mauricio Tsugawa 1
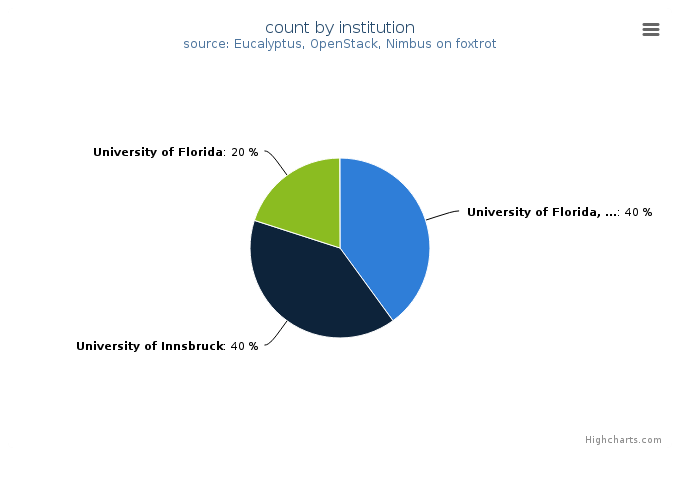
VMs count by institution
Figure 8: VMs count by institution
This chart illustrates the proportion of launched VM instances by Institution. The same data in tabular form follows.
  • Period: December 01 – December 23, 2013
  • Cloud(IaaS): nimbus
  • Hostname: foxtrot
VMs count by institution
Institution Value
University of Florida, Electrical and Computer Engineering 2
University of Innsbruck 2
University of Florida 1
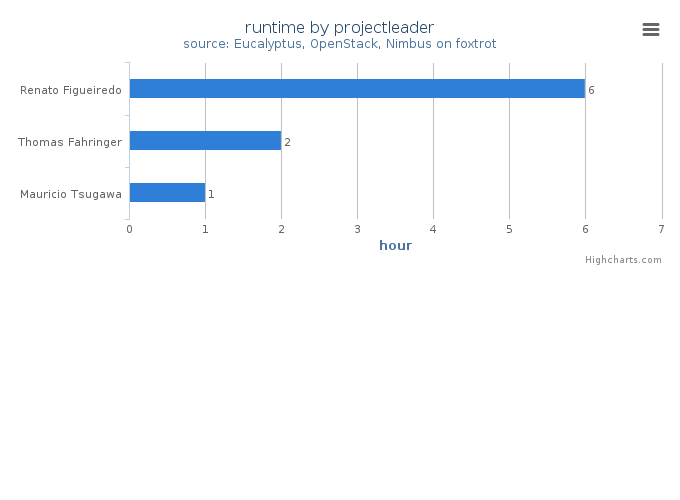
Wall time (hours) by project leader
Figure 9: Wall time (hours) by project leader
This chart illustrates proportionate total run times by project leader.
  • Period: December 01 – December 23, 2013
  • Cloud(IaaS): nimbus
  • Hostname: foxtrot

System information

System information shows utilization distribution as to VMs count and wall time. Each cluster represents a compute node.

VMs count by systems in Cluster (foxtrot)
Figure 10: VMs count by systems (compute nodes) in Cluster (foxtrot)
This column chart represents VMs count among systems.
  • Period: December 01 – December 23, 2013
  • Cloud(IaaS): nimbus
  • Hostname: foxtrot
Wall time (hours) by systems in Cluster (foxtrot)
Figure 11: Wall time (hours) by systems (compute nodes) in Cluster (foxtrot)
This column chart represents wall time among systems.
  • Period: December 01 – December 23, 2013
  • Cloud(IaaS): nimbus
  • Hostname: foxtrot