|
|
FutureGrid Cloud Metric |
|
|
FutureGrid Cloud Metric |
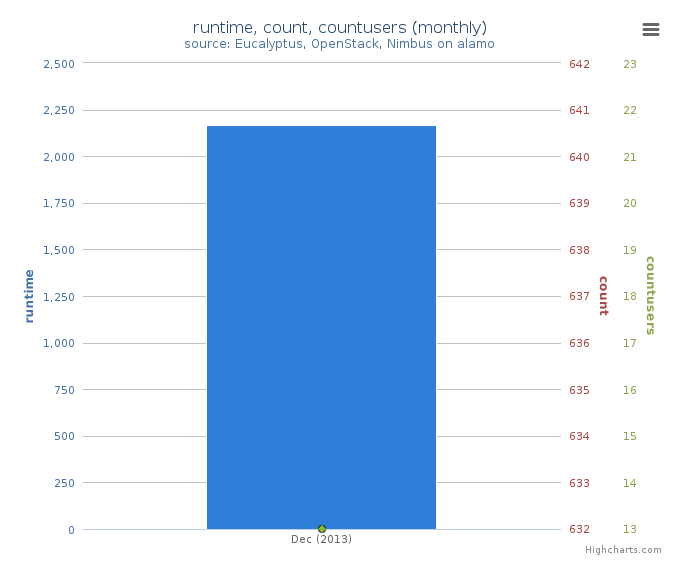
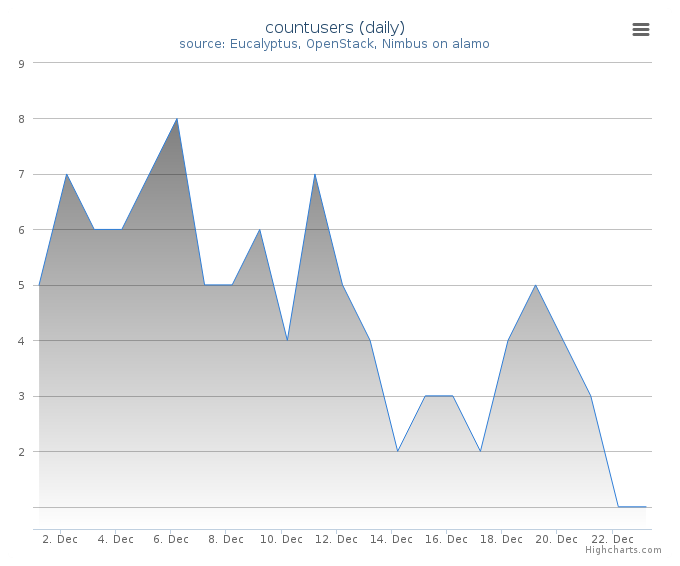
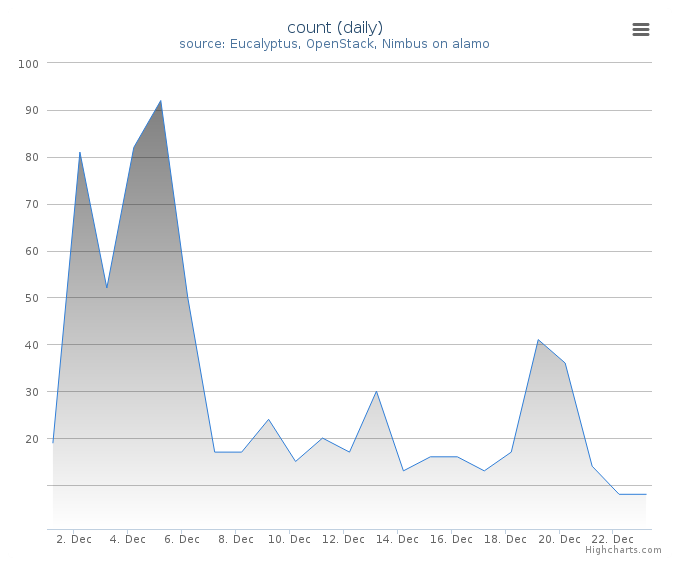
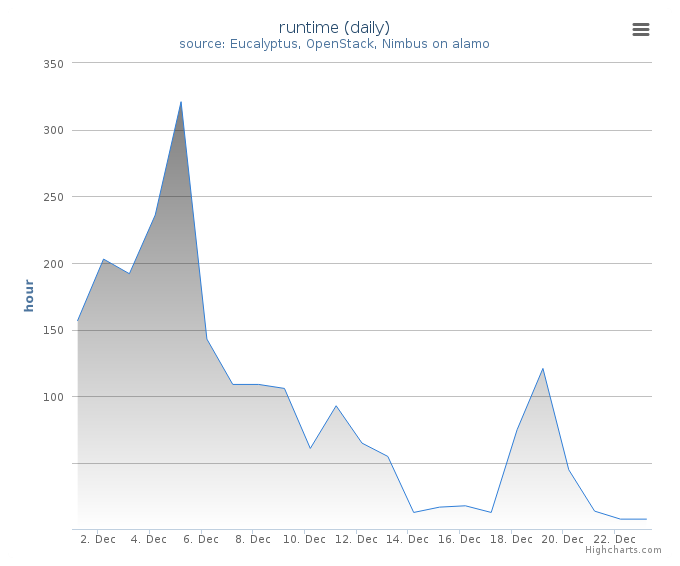
Period: December 01 – December 23, 2013
Cloud(IaaS): nimbus, openstack
Hostname: alamo
| Project | Value |
|---|---|
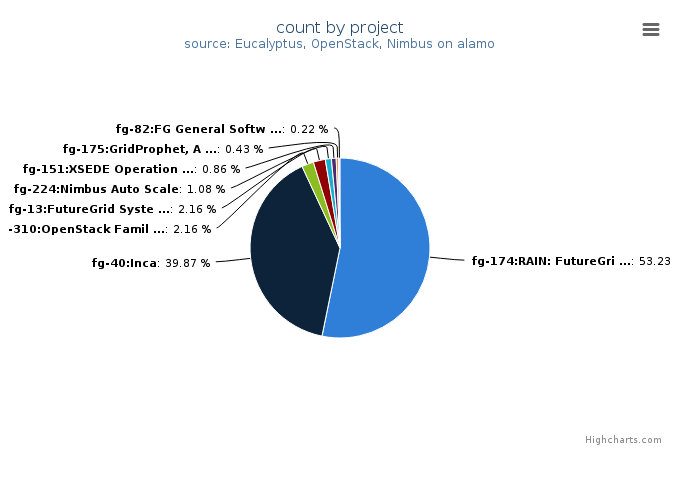
| fg-174:RAIN: FutureGrid Dynamic provisioning Framework | 247 |
| fg-40:Inca | 185 |
| fg-310:OpenStack Familiarization for TACC | 10 |
| fg-13:FutureGrid Systems Development and Prototyping | 10 |
| fg-224:Nimbus Auto Scale | 5 |
| fg-151:XSEDE Operations Group | 4 |
| fg-175:GridProphet, A workflow execution time prediction system for the Grid | 2 |
| fg-82:FG General Software Development | 1 |
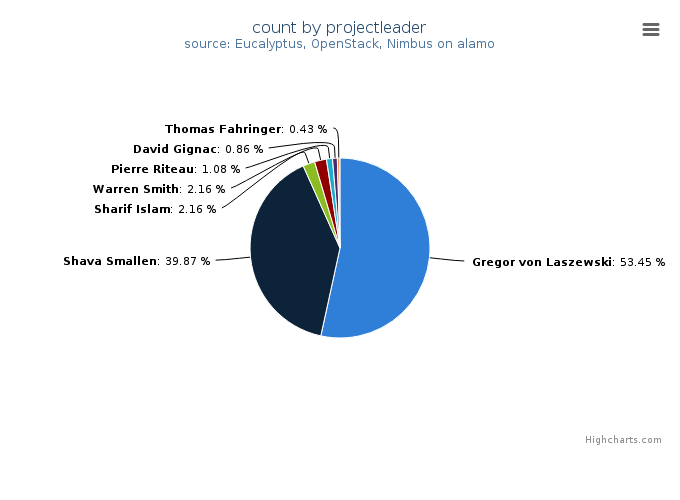
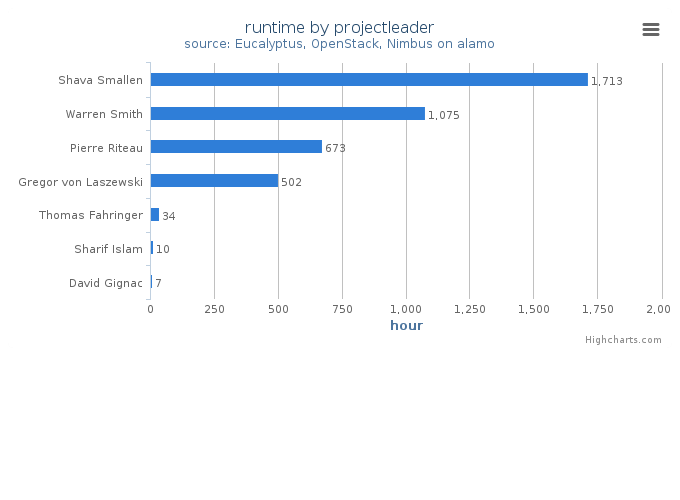
| Projectleader | Value |
|---|---|
| Gregor von Laszewski | 248 |
| Shava Smallen | 185 |
| Sharif Islam | 10 |
| Warren Smith | 10 |
| Pierre Riteau | 5 |
| David Gignac | 4 |
| Thomas Fahringer | 2 |
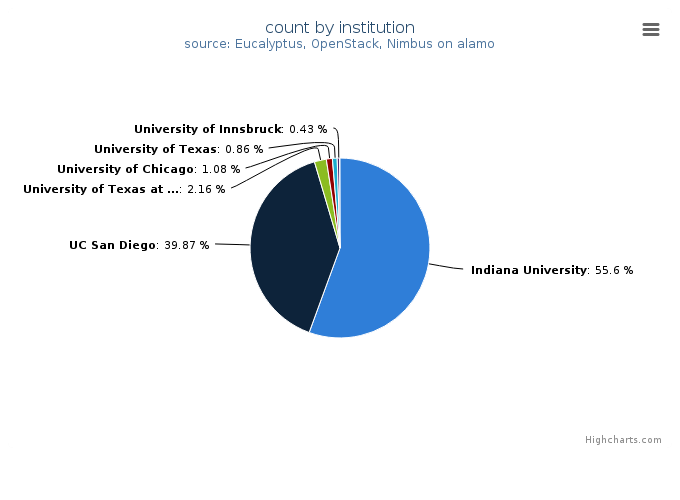
| Institution | Value |
|---|---|
| Indiana University | 258 |
| UC San Diego | 185 |
| University of Texas at Austin, Texas Advanced Computing Center | 10 |
| University of Chicago | 5 |
| University of Texas | 4 |
| University of Innsbruck | 2 |
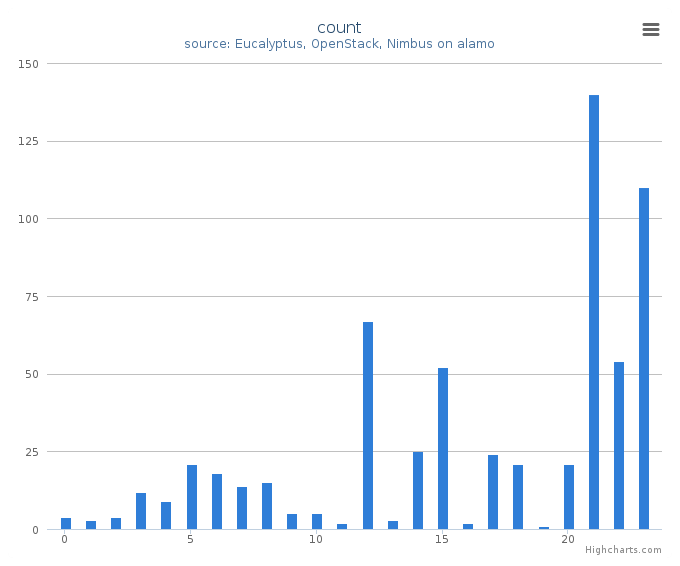
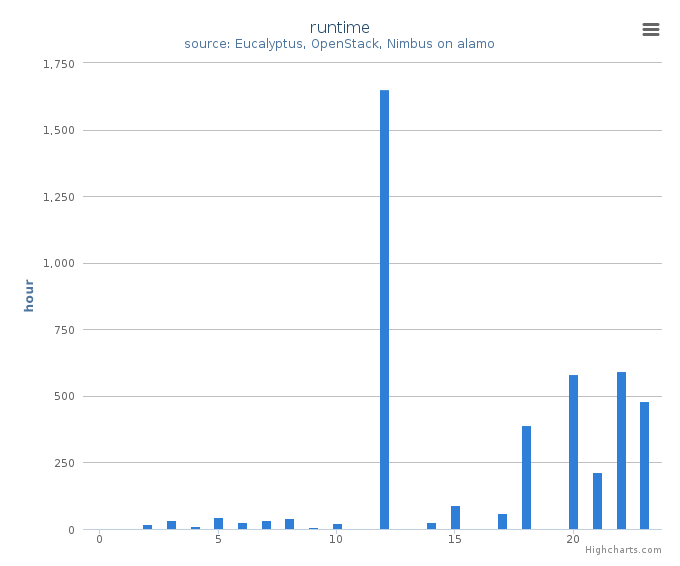
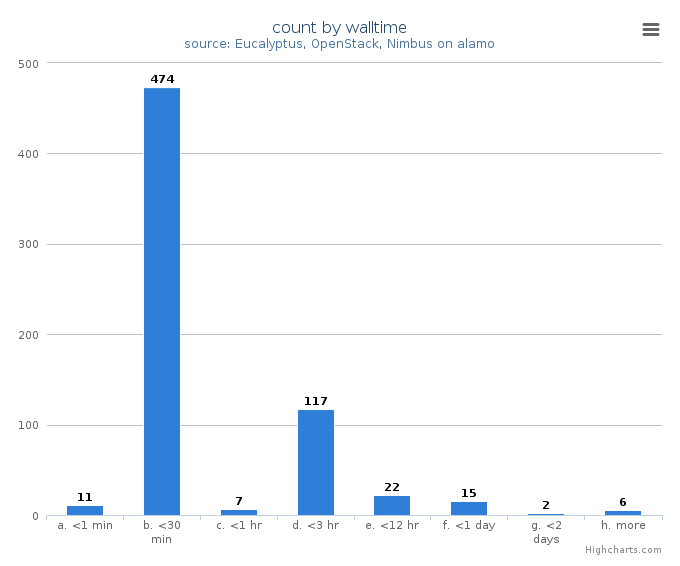
System information shows utilization distribution as to VMs count and wall time. Each cluster represents a compute node.