|
|
FutureGrid Cloud Metric |
|
|
FutureGrid Cloud Metric |
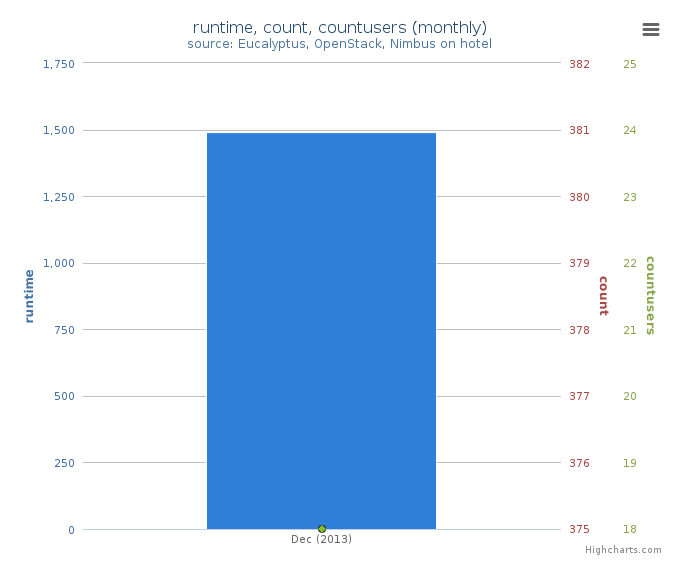
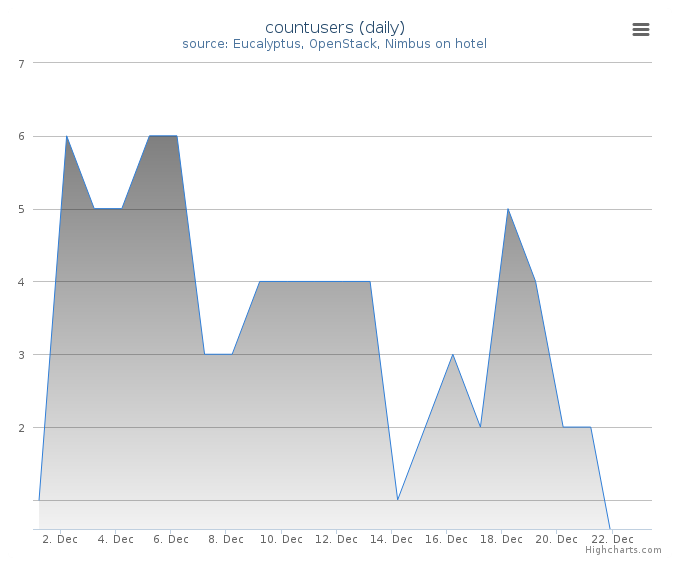
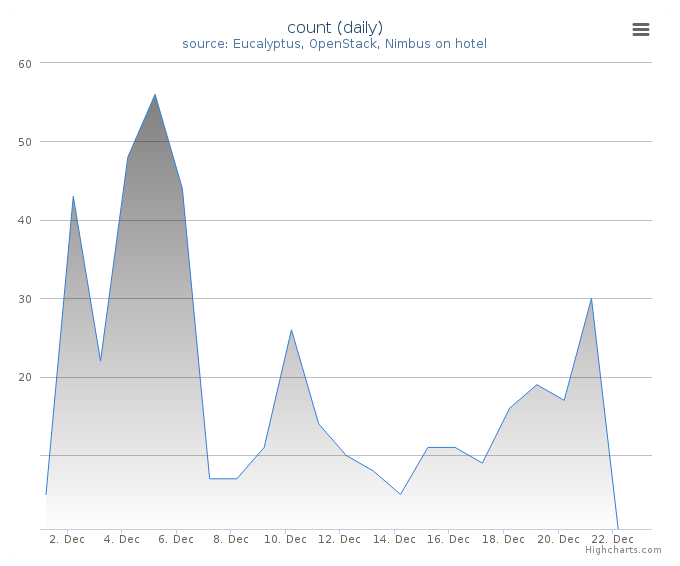
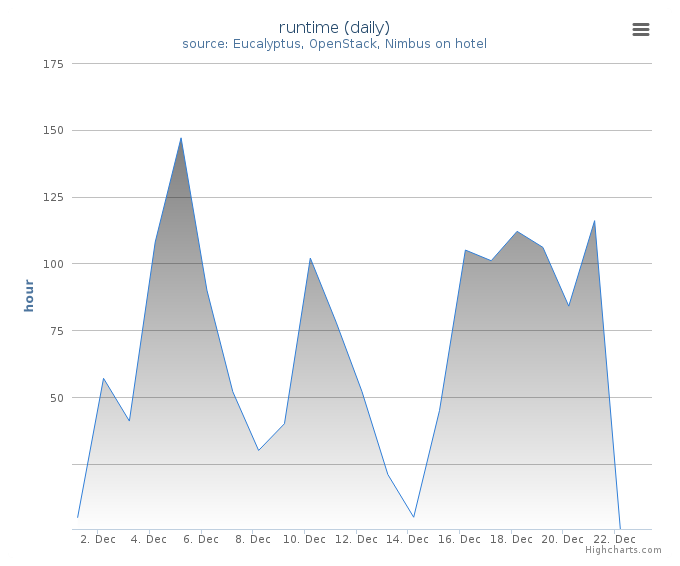
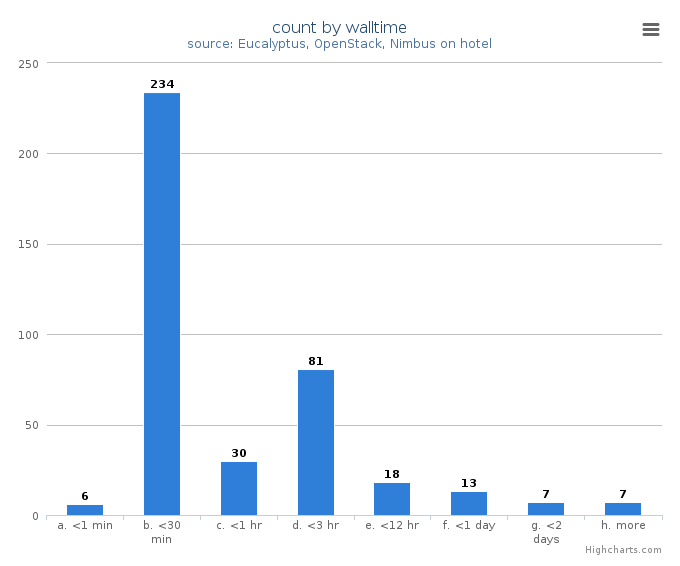
Period: December 01 – December 23, 2013
Cloud(IaaS): nimbus
Hostname: hotel
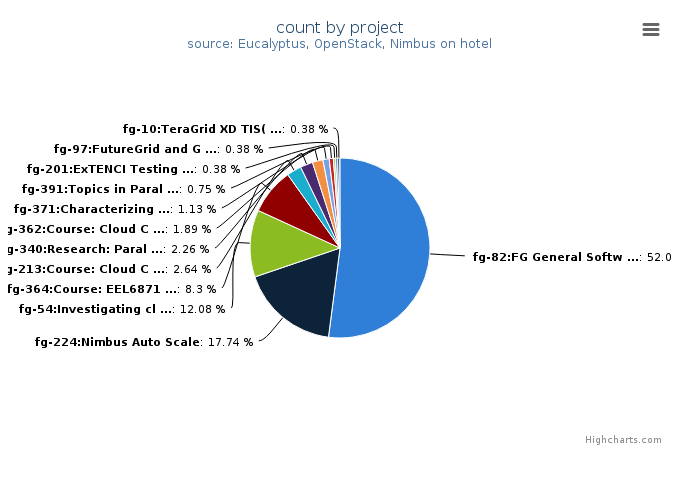
| Project | Value |
|---|---|
| fg-82:FG General Software Development | 138 |
| fg-224:Nimbus Auto Scale | 47 |
| fg-54:Investigating cloud computing as a solution for analyzing particle physics data | 32 |
| fg-364:Course: EEL6871 Autonomic Computing | 22 |
| fg-213:Course: Cloud Computing class - second edition | 7 |
| fg-340:Research: Parallel Computing for Machine Learning | 6 |
| fg-362:Course: Cloud Computing and Storage (UF) | 5 |
| fg-371:Characterizing Infrastructure Cloud Performance for Scientific Computing | 3 |
| fg-391:Topics in Parallel Computation | 2 |
| fg-201:ExTENCI Testing, Validation, and Performance | 1 |
| fg-97:FutureGrid and Grid‘5000 Collaboration | 1 |
| fg-10:TeraGrid XD TIS(Technology Insertion Service) Technology Evaluation Laboratory | 1 |
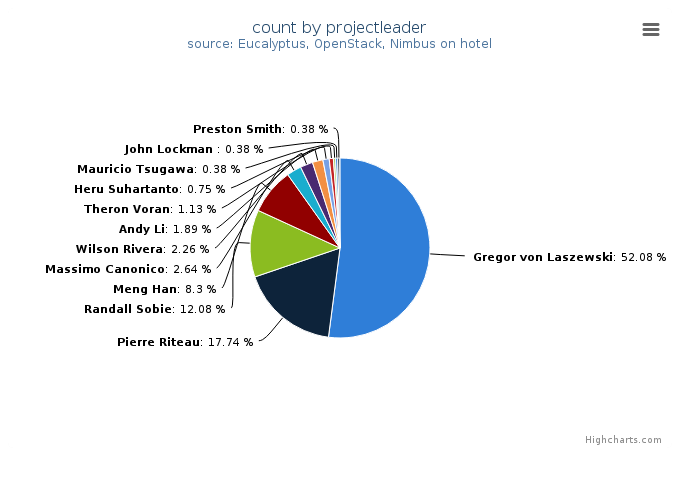
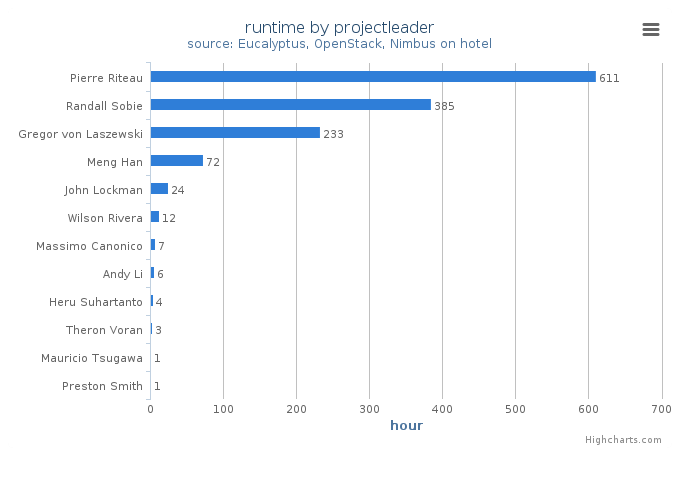
| Projectleader | Value |
|---|---|
| Gregor von Laszewski | 138 |
| Pierre Riteau | 47 |
| Randall Sobie | 32 |
| Meng Han | 22 |
| Massimo Canonico | 7 |
| Wilson Rivera | 6 |
| Andy Li | 5 |
| Theron Voran | 3 |
| Heru Suhartanto | 2 |
| Mauricio Tsugawa | 1 |
| John Lockman | 1 |
| Preston Smith | 1 |
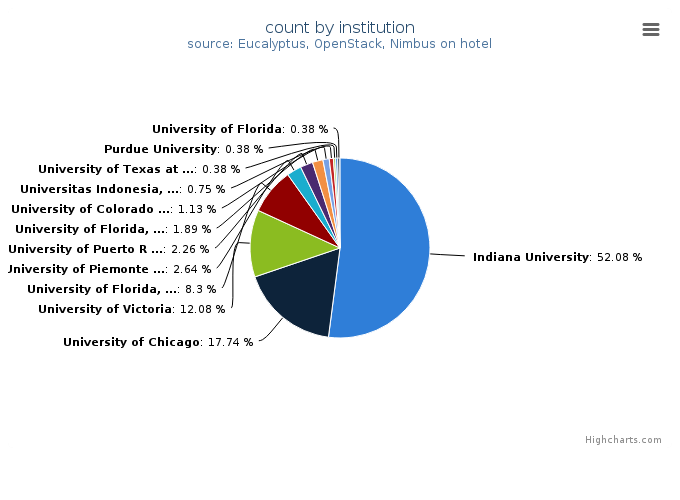
| Institution | Value |
|---|---|
| Indiana University | 138 |
| University of Chicago | 47 |
| University of Victoria | 32 |
| University of Florida, ACIS | 22 |
| University of Piemonte Orientale | 7 |
| University of Puerto Rico, Electrical and Computer Emgineering D | 6 |
| University of Florida, Department of Electrical and Computer Eng | 5 |
| University of Colorado at Boulder, Computer Science Department | 3 |
| Universitas Indonesia, Faculty of Computer Science | 2 |
| University of Texas at Austin | 1 |
| Purdue University | 1 |
| University of Florida | 1 |
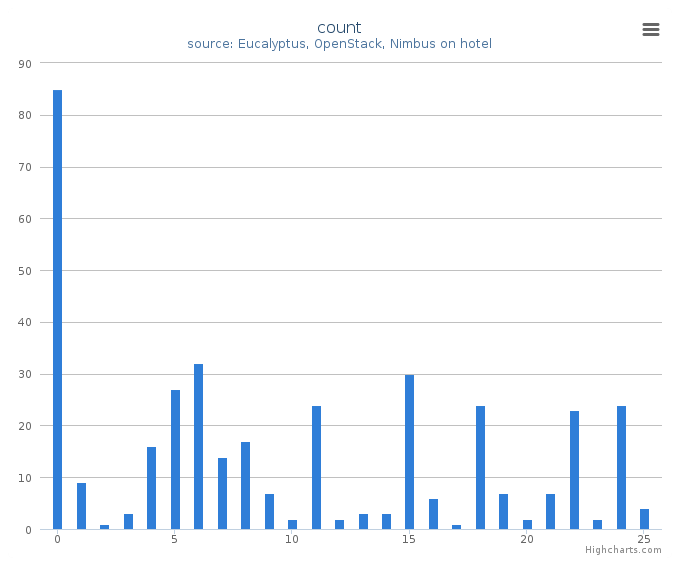
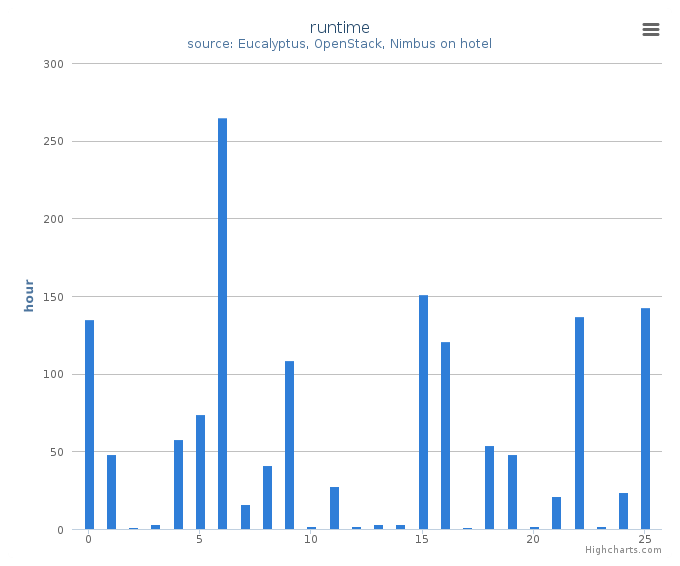
System information shows utilization distribution as to VMs count and wall time. Each cluster represents a compute node.