|
|
FutureGrid Cloud Metric |
|
|
FutureGrid Cloud Metric |
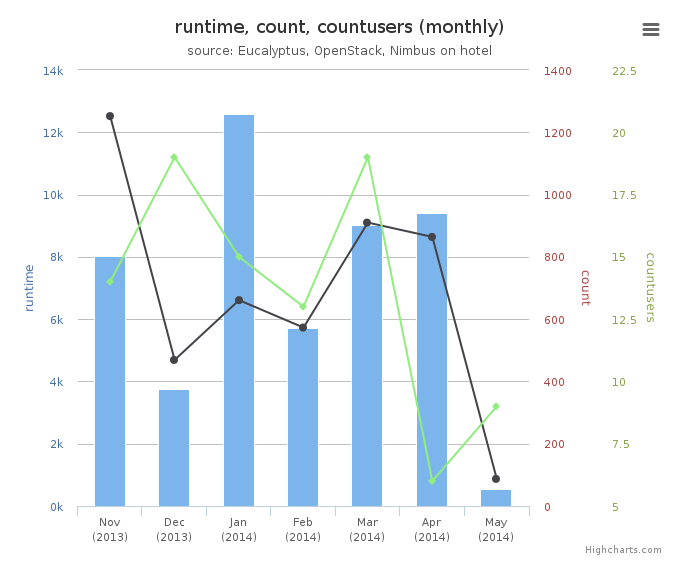
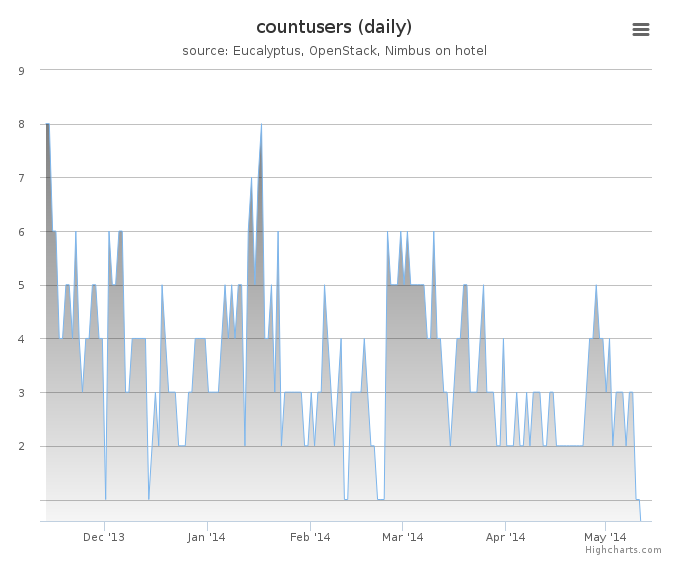
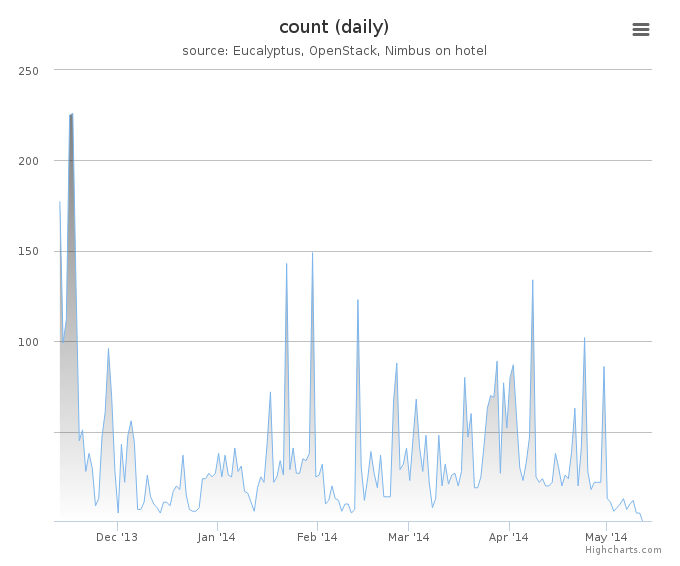
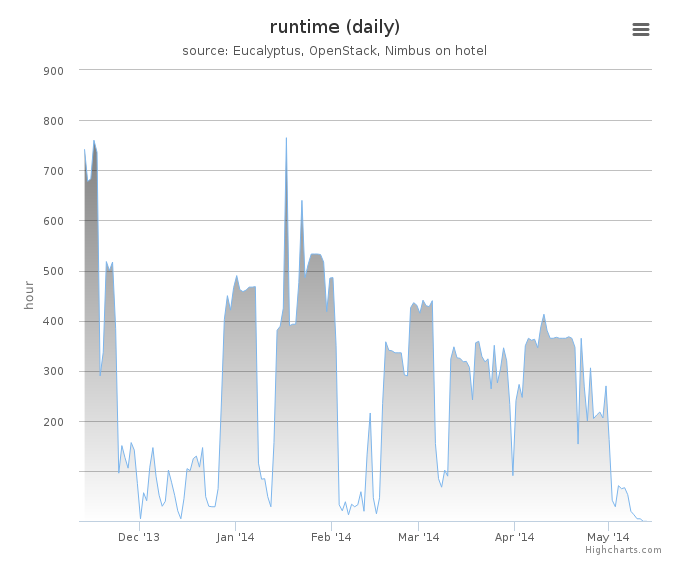
Period: November 13 – May 13, 2014
Cloud(IaaS): nimbus
Hostname: hotel
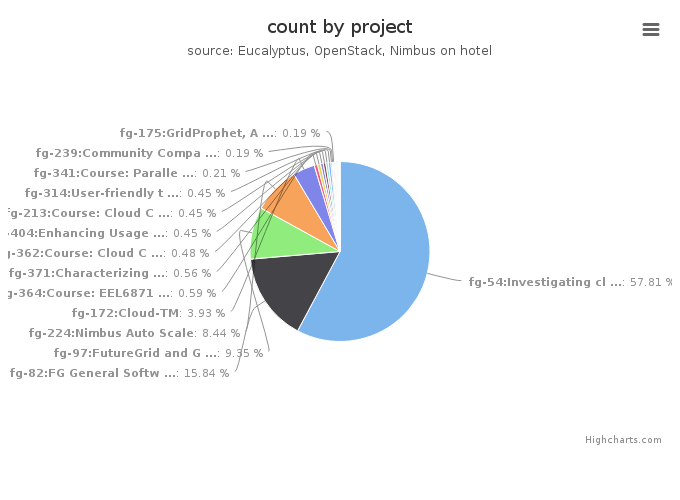
| Project | Value |
|---|---|
| fg-54:Investigating cloud computing as a solution for analyzing particle physics data | 2164 |
| fg-82:FG General Software Development | 593 |
| fg-97:FutureGrid and Grid‘5000 Collaboration | 350 |
| fg-224:Nimbus Auto Scale | 316 |
| fg-172:Cloud-TM | 147 |
| fg-364:Course: EEL6871 Autonomic Computing | 22 |
| fg-371:Characterizing Infrastructure Cloud Performance for Scientific Computing | 21 |
| fg-362:Course: Cloud Computing and Storage (UF) | 18 |
| fg-404:Enhancing Usage of cloud Infrastructure | 17 |
| fg-213:Course: Cloud Computing class - second edition | 17 |
| fg-314:User-friendly tools to play with cloud platforms | 17 |
| fg-341:Course: Parallel Computing | 8 |
| fg-239:Community Comparison of Cloud frameworks | 7 |
| fg-175:GridProphet, A workflow execution time prediction system for the Grid | 7 |
| fg-340:Research: Parallel Computing for Machine Learning | 6 |
| fg-150:SC11: Using and Building Infrastructure Clouds for Science | 6 |
| fg-217:Cloud Computing In Education | 6 |
| fg-9:Distributed Execution of Kepler Scientific Workflow on Future Grid | 5 |
| fg-374:Course: Cloud and Distributed Computing | 3 |
| fg-10:TeraGrid XD TIS(Technology Insertion Service) Technology Evaluation Laboratory | 3 |
| fg-391:Topics in Parallel Computation | 2 |
| fg-165:The VIEW Project | 2 |
| fg-298:FRIEDA: Flexible Robust Intelligent Elastic Data Management | 2 |
| fg-372:Mobile Device Computation Offloading over SocialVPNs | 2 |
| fg-201:ExTENCI Testing, Validation, and Performance | 1 |
| fg-401:Evaluation of HPC Applications on Cloud Resources | 1 |
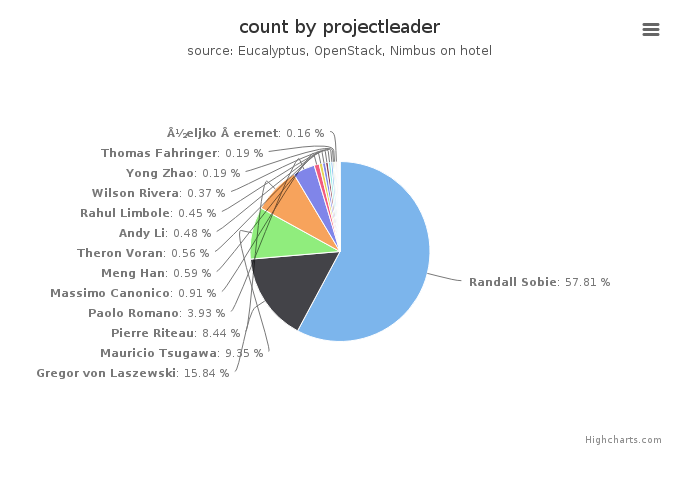
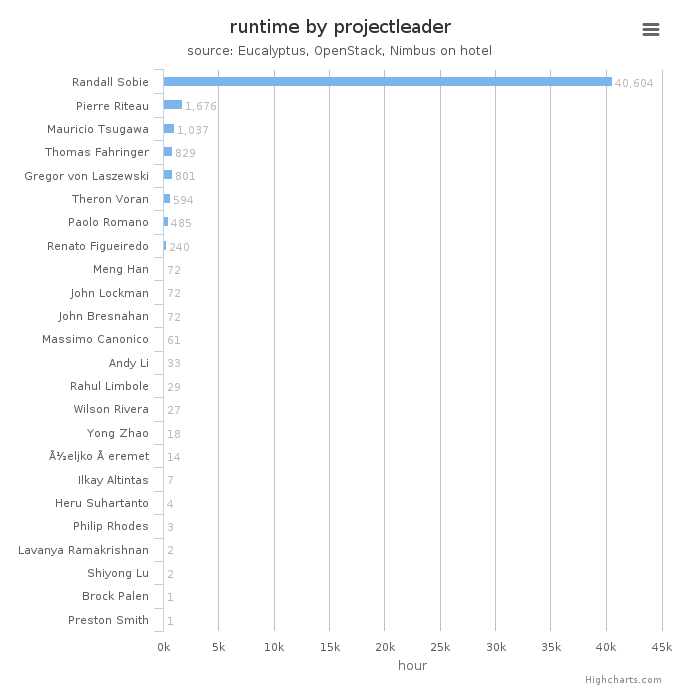
| Projectleader | Value |
|---|---|
| Randall Sobie | 2164 |
| Gregor von Laszewski | 593 |
| Mauricio Tsugawa | 350 |
| Pierre Riteau | 316 |
| Paolo Romano | 147 |
| Massimo Canonico | 34 |
| Meng Han | 22 |
| Theron Voran | 21 |
| Andy Li | 18 |
| Rahul Limbole | 17 |
| Wilson Rivera | 14 |
| Yong Zhao | 7 |
| Thomas Fahringer | 7 |
| John Bresnahan | 6 |
| Željko Šeremet | 6 |
| Ilkay Altintas | 5 |
| John Lockman | 3 |
| Philip Rhodes | 3 |
| Renato Figueiredo | 2 |
| Lavanya Ramakrishnan | 2 |
| Heru Suhartanto | 2 |
| Shiyong Lu | 2 |
| Brock Palen | 1 |
| Preston Smith | 1 |
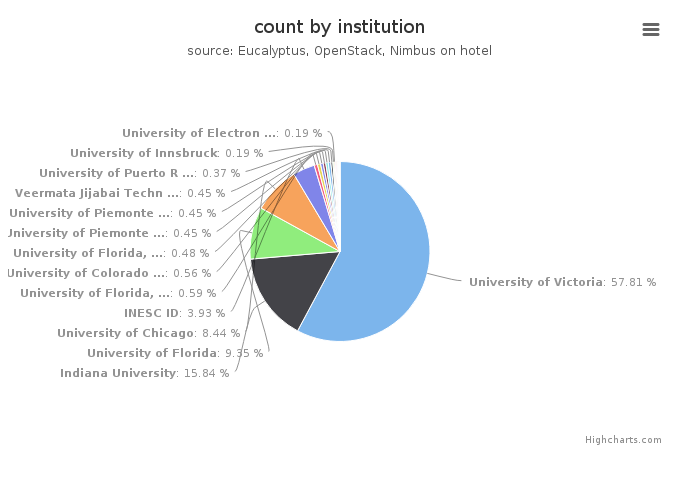
| Institution | Value |
|---|---|
| University of Victoria | 2164 |
| Indiana University | 593 |
| University of Florida | 350 |
| University of Chicago | 316 |
| INESC ID | 147 |
| University of Florida, ACIS | 22 |
| University of Colorado at Boulder, Computer Science Department | 21 |
| University of Florida, Department of Electrical and Computer Eng | 18 |
| University of Piemonte Orientale | 17 |
| University of Piemonte Orientale, Computer Science Department | 17 |
| Veermata Jijabai Technological Institute Mumbai, Computer Scienc | 17 |
| University of Puerto Rico, Electrical and Computer Emgineering D | 14 |
| University of Innsbruck | 7 |
| University of Electronic Science and Technology | 7 |
| University of Mostar | 6 |
| Nimbus | 6 |
| UCSD | 5 |
| University of Texas at Austin | 3 |
| University of Mississippi, Department of Computer Science | 3 |
| University of Florida, Electrical and Computer Engineering | 2 |
| Wayne State University | 2 |
| Lawrence Berkeley National Lab | 2 |
| Universitas Indonesia, Faculty of Computer Science | 2 |
| Purdue University | 1 |
| U of Michigan / Xsede, CAEN HPC | 1 |
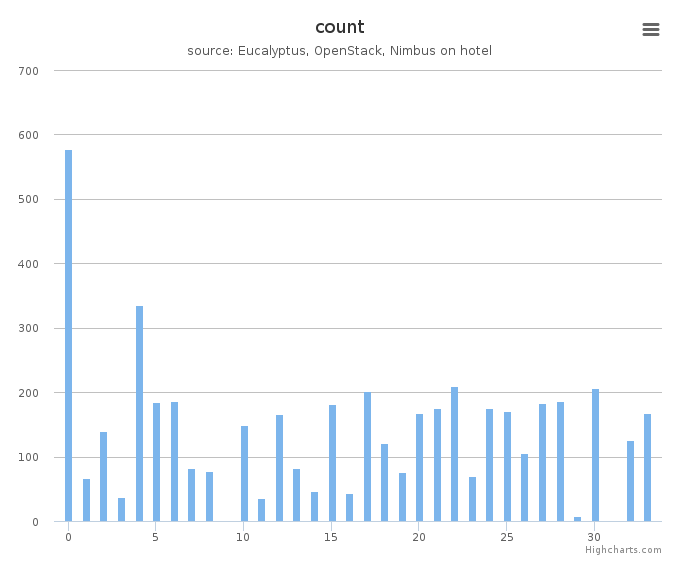
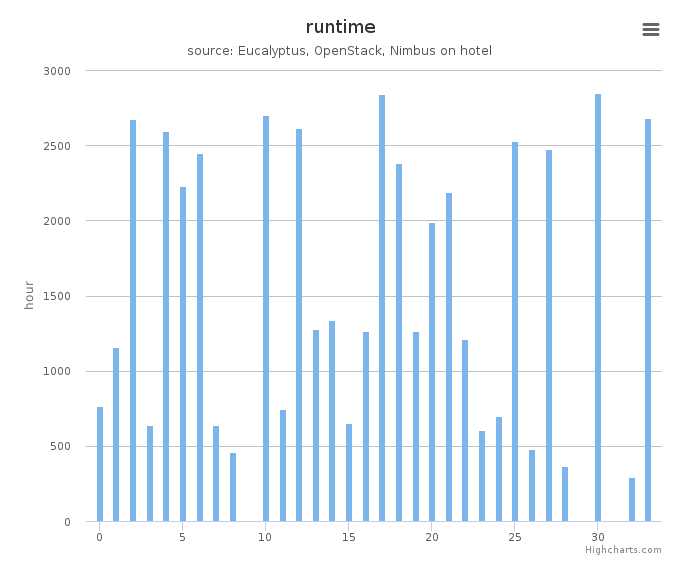
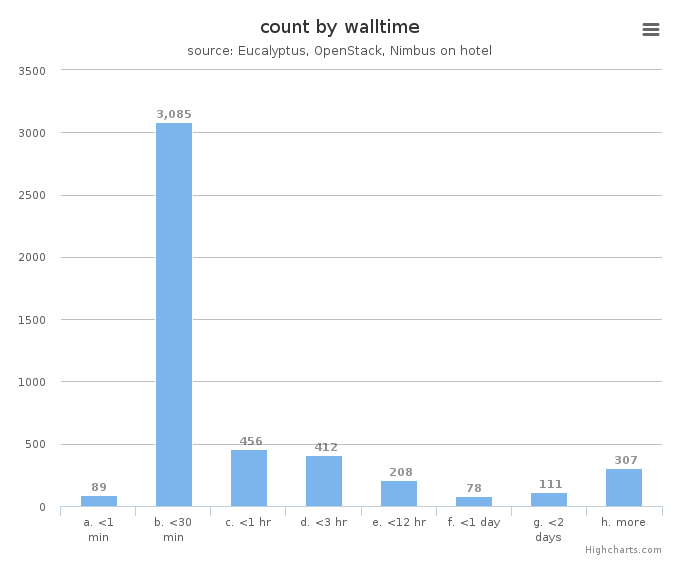
System information shows utilization distribution as to VMs count and wall time. Each cluster represents a compute node.