|
|
FutureGrid Cloud Metric |
|
|
FutureGrid Cloud Metric |
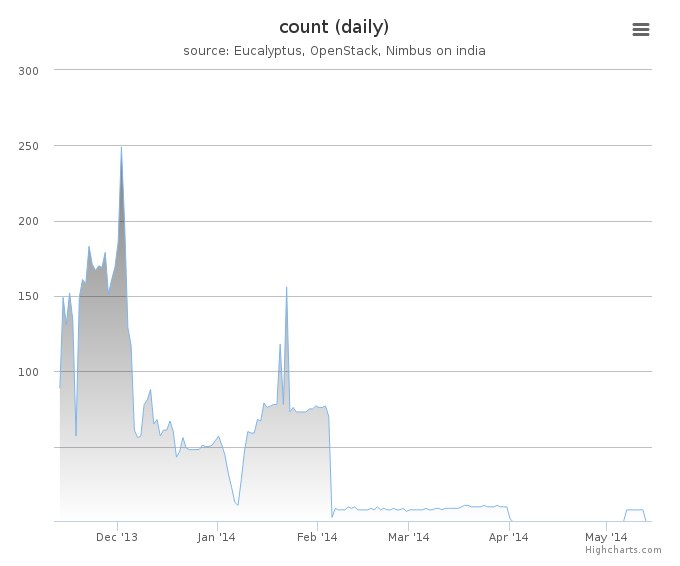
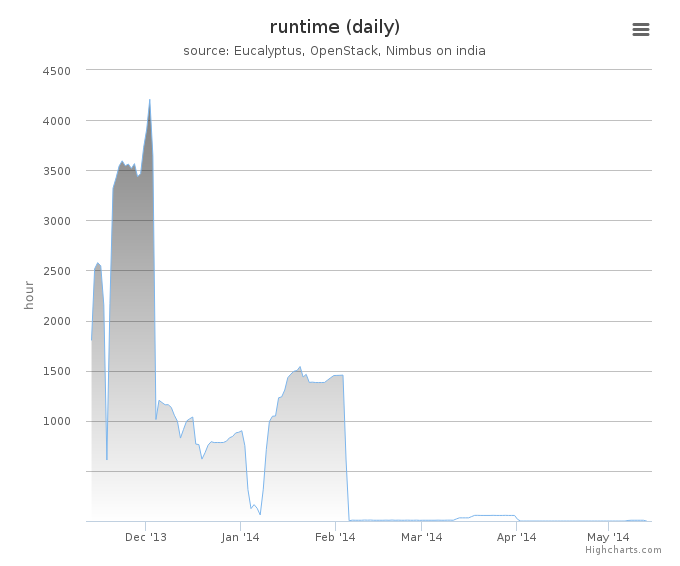
Period: November 13 – May 13, 2014
Cloud(IaaS): openstack, eucalyptus
Hostname: india
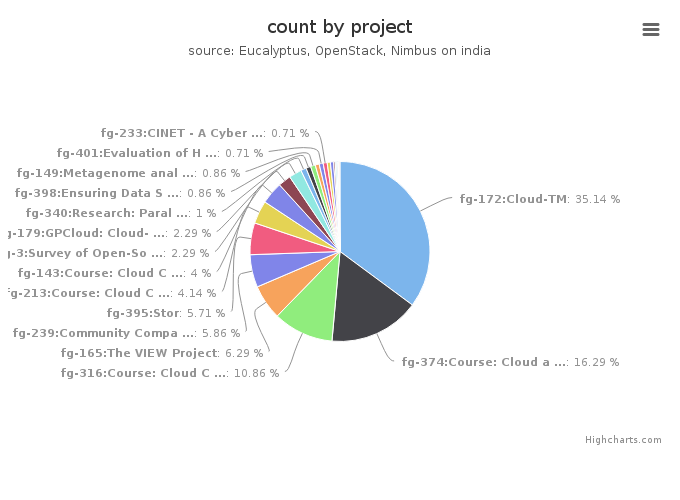
| Project | Value |
|---|---|
| fg-172:Cloud-TM | 246 |
| fg-374:Course: Cloud and Distributed Computing | 114 |
| fg-316:Course: Cloud Computing Class - third edition | 76 |
| fg-165:The VIEW Project | 44 |
| fg-239:Community Comparison of Cloud frameworks | 41 |
| fg-395:Stor | 40 |
| fg-213:Course: Cloud Computing class - second edition | 29 |
| fg-143:Course: Cloud Computing for Data Intensive Science Class | 28 |
| fg-3:Survey of Open-Source Cloud Infrastructure using FutureGrid Testbed | 16 |
| fg-179:GPCloud: Cloud-based Automatic Repair of Real-World Software Bugs | 16 |
| fg-340:Research: Parallel Computing for Machine Learning | 7 |
| fg-398:Ensuring Data Security and Accountability for Data Sharing in the Cloud | 6 |
| fg-149:Metagenome analysis of benthic marine invertebrates | 6 |
| fg-82:FG General Software Development | 5 |
| fg-401:Evaluation of HPC Applications on Cloud Resources | 5 |
| fg-233:CINET - A Cyber-Infrastructure for Network Science | 5 |
| fg-201:ExTENCI Testing, Validation, and Performance | 4 |
| fg-249:Large Scale Computing Infrastructure 2012 Master class | 4 |
| fg-384:Graph/network analysis Resource manager | 2 |
| fg-42:SAGA | 2 |
| fg-20:Development of an information service for FutureGrid | 1 |
| fg-369:Testing of Network Facing Services for the Open Science Grid | 1 |
| fg-253:Characterizing Performance of Infrastructure Clouds | 1 |
| fg-136:JGC-DataCloud-2012 paper experiments | 1 |
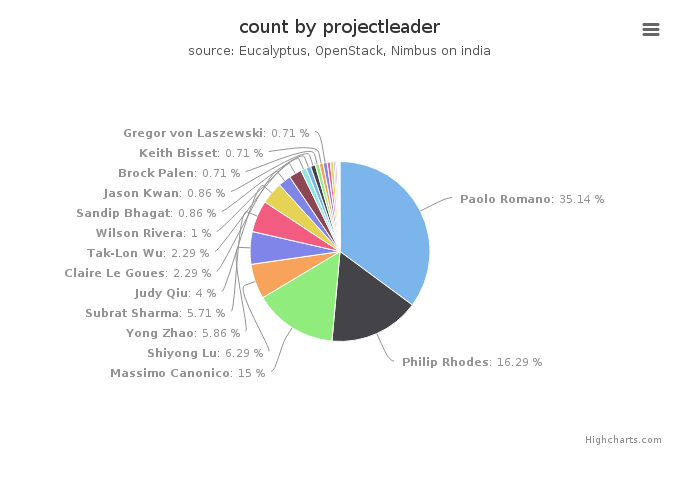
| Projectleader | Value |
|---|---|
| Paolo Romano | 246 |
| Philip Rhodes | 114 |
| Massimo Canonico | 105 |
| Shiyong Lu | 44 |
| Yong Zhao | 41 |
| Subrat Sharma | 40 |
| Judy Qiu | 28 |
| Claire Le Goues | 16 |
| Tak-Lon Wu | 16 |
| Wilson Rivera | 7 |
| Sandip Bhagat | 6 |
| Jason Kwan | 6 |
| Brock Palen | 5 |
| Keith Bisset | 5 |
| Gregor von Laszewski | 5 |
| Sergio Maffioletti | 4 |
| Preston Smith | 4 |
| Shantenu Jha | 2 |
| Tirtha Bhattacharjee | 2 |
| Mats Rynge | 1 |
| Hyungro Lee | 1 |
| Paul Marshall | 1 |
| Igor Sfiligoi | 1 |
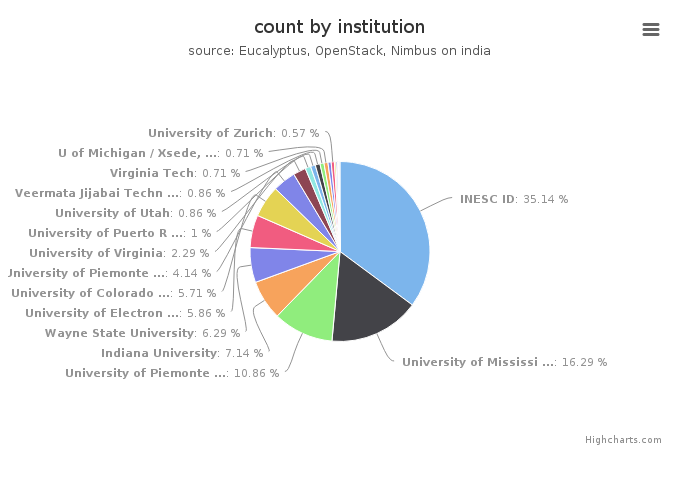
| Institution | Value |
|---|---|
| INESC ID | 246 |
| University of Mississippi, Department of Computer Science | 114 |
| University of Piemonte Orientale, Computer Science Department | 76 |
| Indiana University | 50 |
| Wayne State University | 44 |
| University of Electronic Science and Technology | 41 |
| University of Colorado, Computer Science Department | 40 |
| University of Piemonte Orientale | 29 |
| University of Virginia | 16 |
| University of Puerto Rico, Electrical and Computer Emgineering D | 7 |
| University of Utah | 6 |
| Veermata Jijabai Technological University, Mumbai India. , Veerm | 6 |
| Virginia Tech | 5 |
| U of Michigan / Xsede, CAEN HPC | 5 |
| Purdue University | 4 |
| University of Zurich | 4 |
| Louisiana State University | 2 |
| Virginia Bioinformatics Institute, Virginia Polytechnic Institut | 2 |
| USC | 1 |
| University of California San Diego, Physics Department | 1 |
| University of Colorado at Boulder | 1 |
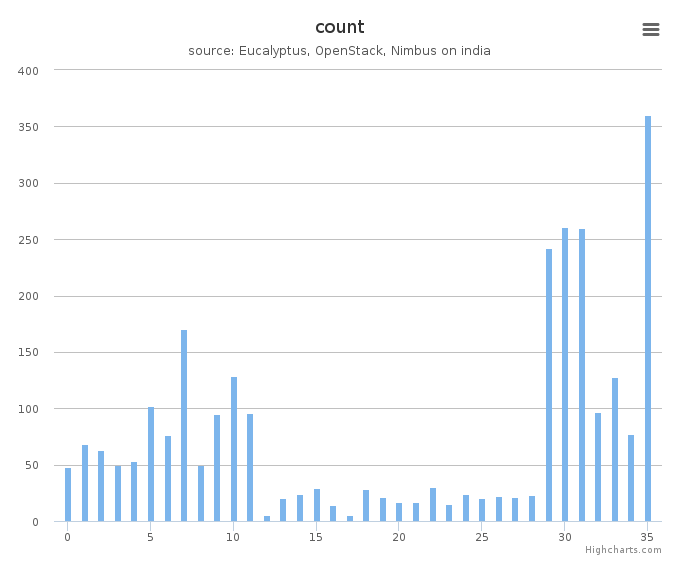
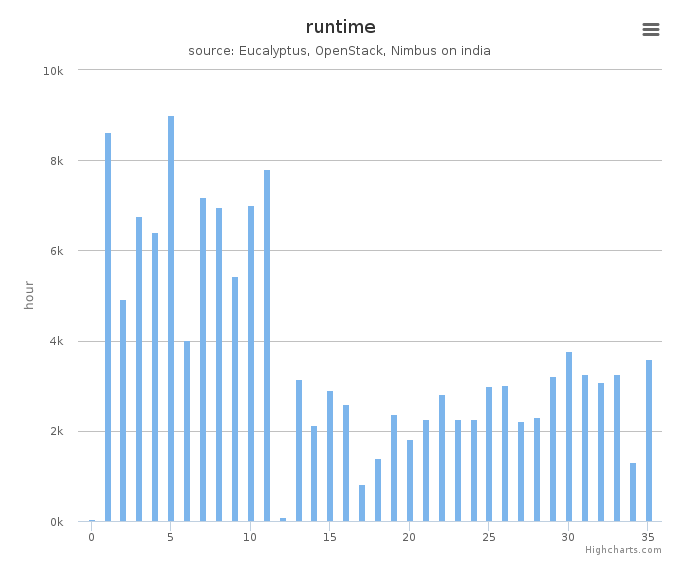
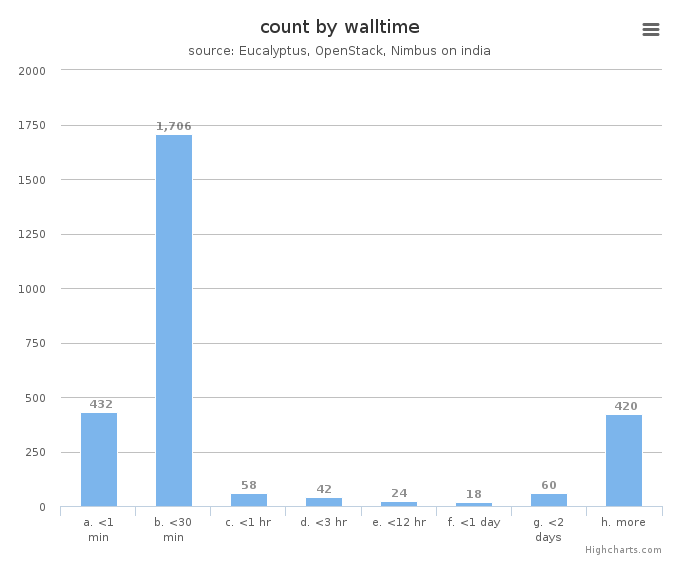
System information shows utilization distribution as to VMs count and wall time. Each cluster represents a compute node.