FutureGrid Cloud Metric FutureGrid

Cloud Metric

Table Of Contents

Previous topic

Usage Report sierra

Next topic

Usage Report hotel

This Page

Usage Report india

  • Period: January 01 – March 31, 2014
  • Hostname: india.futuregrid.org
  • Services: openstack, eucalyptus
  • Metrics: VMs count, Users count, Wall time (hours), Distribution by wall time, project, project leader, and institution, and systems

Histogram

Summary (Monthly)

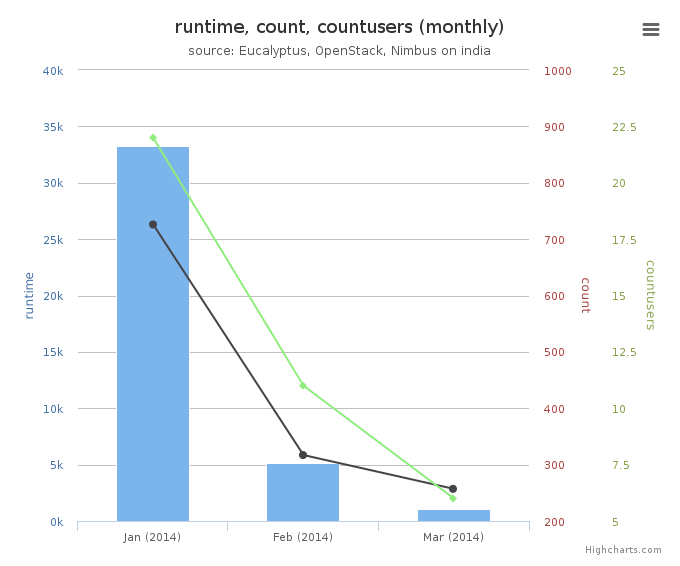
Average Monthly Usage Data (Wall time, Launched VMs, Users)
Figure 1: Average monthly usage data (wall time (hour), launched VMs, users)
This mixed chart represents average monthly usage as to wall time (hour), the number of VM instances and active users.
  • Period: January 01 – March 31, 2014

  • Cloud(IaaS): openstack, eucalyptus

  • Hostname: india

  • Metric:
    • Runtime (Wall time hours): Sum of time elapsed from launch to termination of VM instances
    • Count (VM count): The number of launched VM instances
    • User count (Active): The number of users who launched VMs

Summary (Daily)

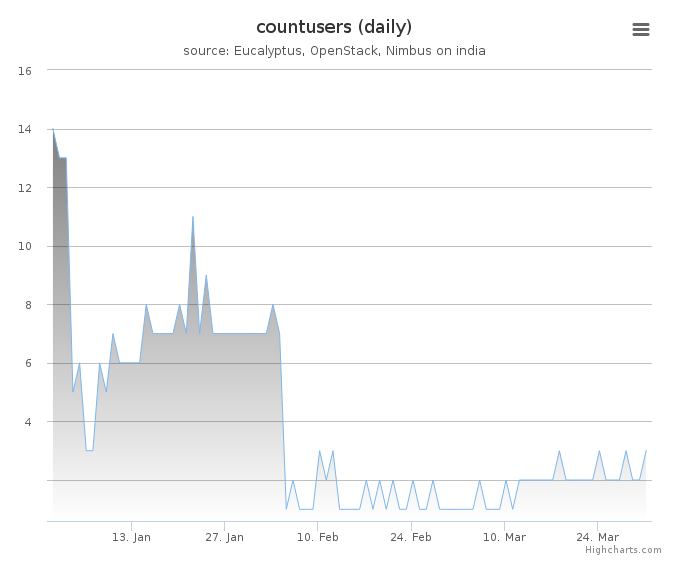
Users count (daily)
Figure 2: Users count
This time series chart represents daily active user count for cloud services and shows historical changes during the period.
  • Period: January 01 – March 31, 2014
  • Cloud(IaaS): openstack, eucalyptus
  • Hostname: india
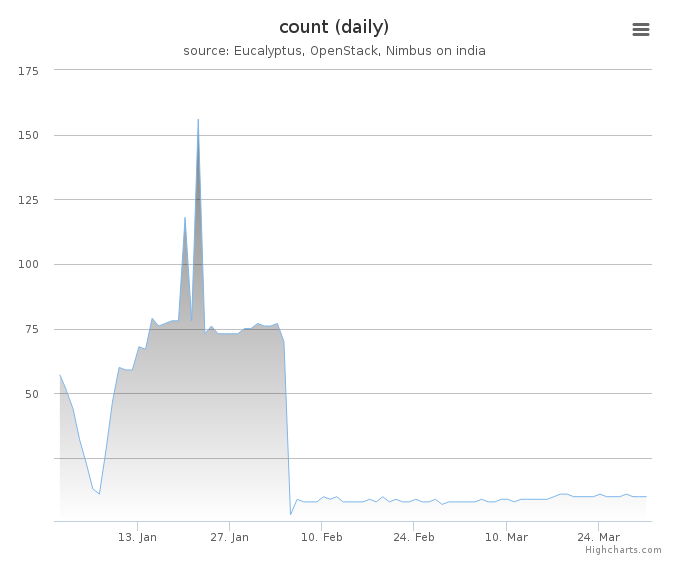
VMs count (daily)
Figure 3: VMs count
This time series chart represents the number of daily launched VM instances for cloud services and shows historical changes during the period.
  • Period: January 01 – March 31, 2014
  • Cloud(IaaS): openstack, eucalyptus
  • Hostname: india
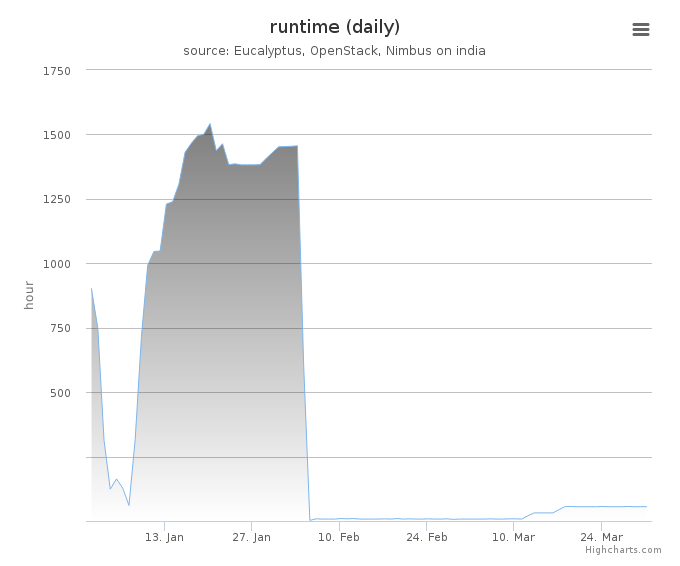
Wall time (hours, daily)
Figure 4: Wall time (hours)
This time series chart represents daily wall time (hours) for cloud services and shows historical changes during the period.
  • Period: January 01 – March 31, 2014
  • Cloud(IaaS): openstack, eucalyptus
  • Hostname: india

Distribution

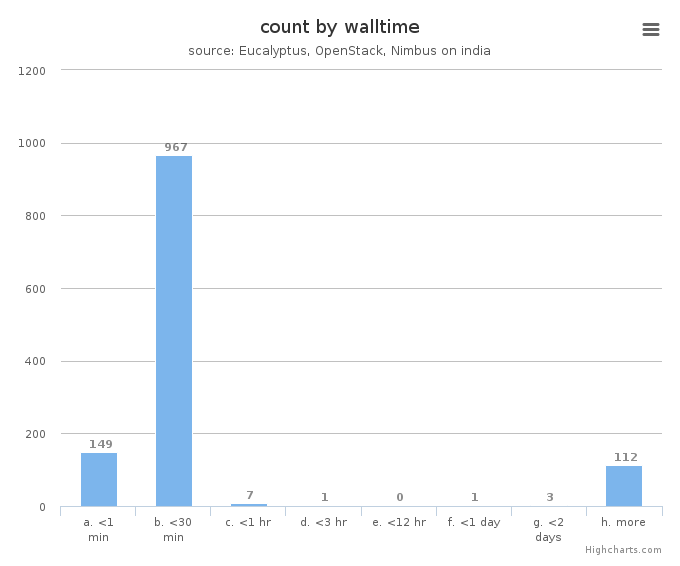
VM count by wall time
Figure 5: VM count by wall time
This chart illustrates usage patterns of VM instances in terms of running wall time.
  • Period: January 01 – March 31, 2014
  • Cloud(IaaS): openstack, eucalyptus
  • Hostname: india
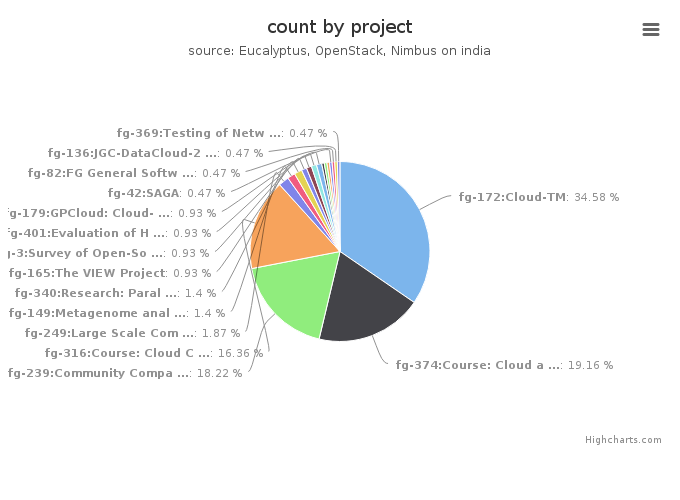
VMs count by project
Figure 6: VMs count by project
This chart illustrates the proportion of launched VM instances by project groups. The same data in tabular form follows.
  • Period: January 01 – March 31, 2014
  • Cloud(IaaS): openstack, eucalyptus
  • Hostname: india
VMs count by project
Project Value
fg-172:Cloud-TM 74
fg-374:Course: Cloud and Distributed Computing 41
fg-239:Community Comparison of Cloud frameworks 39
fg-316:Course: Cloud Computing Class - third edition 35
fg-249:Large Scale Computing Infrastructure 2012 Master class 4
fg-149:Metagenome analysis of benthic marine invertebrates 3
fg-340:Research: Parallel Computing for Machine Learning 3
fg-165:The VIEW Project 2
fg-3:Survey of Open-Source Cloud Infrastructure using FutureGrid Testbed 2
fg-401:Evaluation of HPC Applications on Cloud Resources 2
fg-179:GPCloud: Cloud-based Automatic Repair of Real-World Software Bugs 2
fg-398:Ensuring Data Security and Accountability for Data Sharing in the Cloud 1
fg-384:Graph/network analysis Resource manager 1
fg-253:Characterizing Performance of Infrastructure Clouds 1
fg-42:SAGA 1
fg-82:FG General Software Development 1
fg-136:JGC-DataCloud-2012 paper experiments 1
fg-369:Testing of Network Facing Services for the Open Science Grid 1
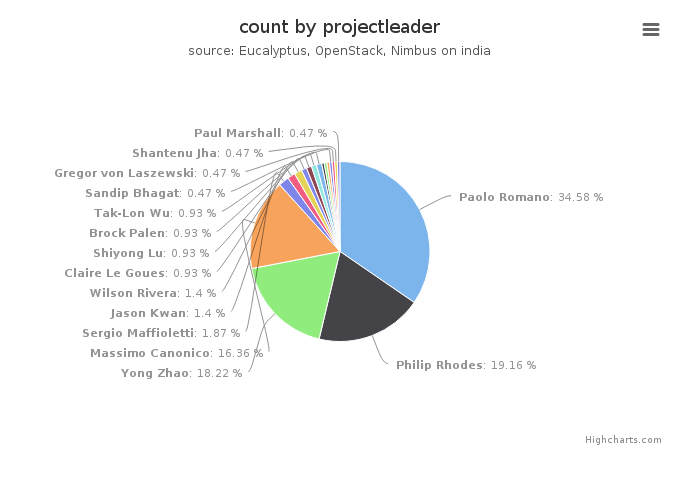
VMs count by project leader
Figure 7: VMs count by project leader
This chart also illustrates the proportion of launched VM instances by project Leader. The same data in tabular form follows.
  • Period: January 01 – March 31, 2014
  • Cloud(IaaS): openstack, eucalyptus
  • Hostname: india
VMs count by project leader
Projectleader Value
Paolo Romano 74
Philip Rhodes 41
Yong Zhao 39
Massimo Canonico 35
Sergio Maffioletti 4
Jason Kwan 3
Wilson Rivera 3
Claire Le Goues 2
Shiyong Lu 2
Brock Palen 2
Tak-Lon Wu 2
Mats Rynge 1
Igor Sfiligoi 1
Tirtha Bhattacharjee 1
Sandip Bhagat 1
Gregor von Laszewski 1
Shantenu Jha 1
Paul Marshall 1
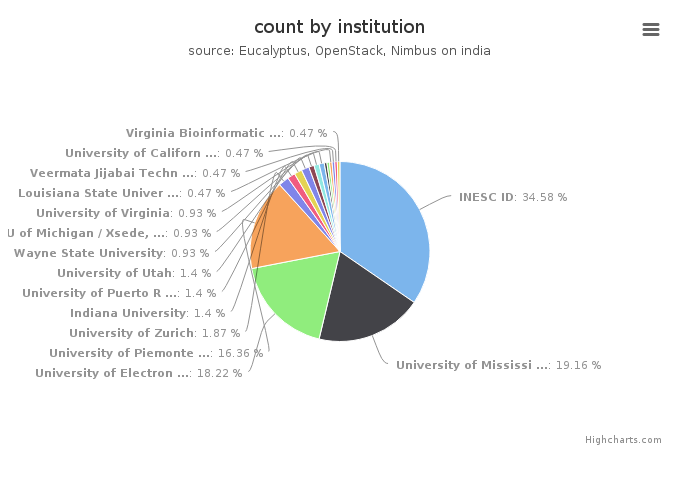
VMs count by institution
Figure 8: VMs count by institution
This chart illustrates the proportion of launched VM instances by Institution. The same data in tabular form follows.
  • Period: January 01 – March 31, 2014
  • Cloud(IaaS): openstack, eucalyptus
  • Hostname: india
VMs count by institution
Institution Value
INESC ID 74
University of Mississippi, Department of Computer Science 41
University of Electronic Science and Technology 39
University of Piemonte Orientale, Computer Science Department 35
University of Zurich 4
Indiana University 3
University of Puerto Rico, Electrical and Computer Emgineering D 3
University of Utah 3
Wayne State University 2
U of Michigan / Xsede, CAEN HPC 2
University of Virginia 2
USC 1
University of Colorado at Boulder 1
Louisiana State University 1
Veermata Jijabai Technological University, Mumbai India. , Veerm 1
University of California San Diego, Physics Department 1
Virginia Bioinformatics Institute, Virginia Polytechnic Institut 1
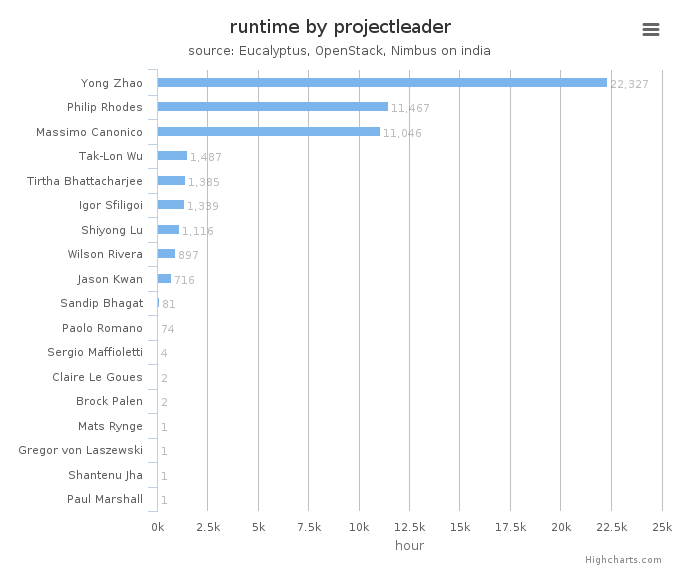
Wall time (hours) by project leader
Figure 9: Wall time (hours) by project leader
This chart illustrates proportionate total run times by project leader.
  • Period: January 01 – March 31, 2014
  • Cloud(IaaS): openstack, eucalyptus
  • Hostname: india

System information

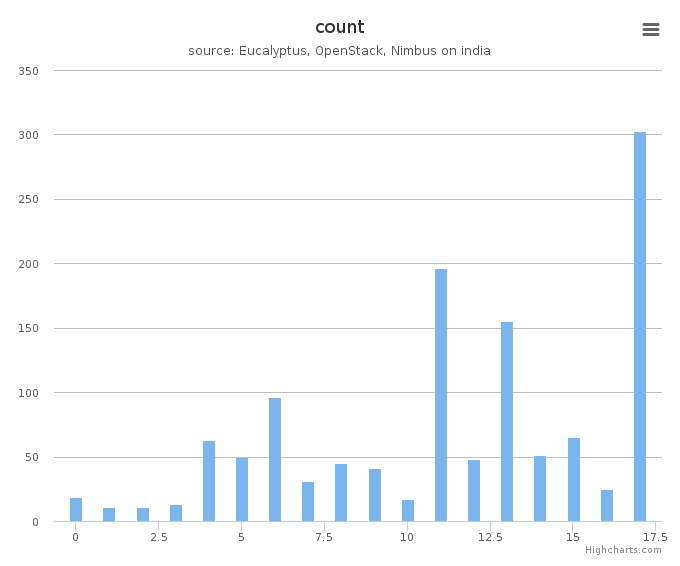
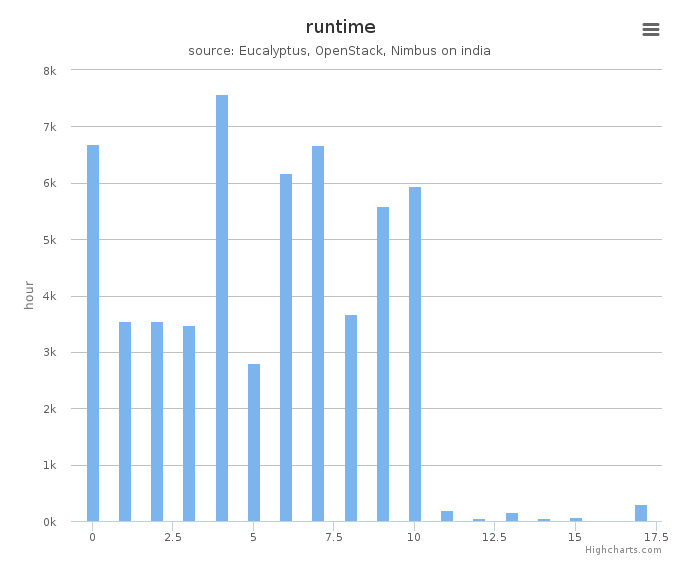
System information shows utilization distribution as to VMs count and wall time. Each cluster represents a compute node.
VMs count by systems in Cluster (india)
Figure 10: VMs count by systems (compute nodes) in Cluster (india)
This column chart represents VMs count among systems.
  • Period: January 01 – March 31, 2014
  • Cloud(IaaS): openstack, eucalyptus
  • Hostname: india
Wall time (hours) by systems in Cluster (india)
Figure 11: Wall time (hours) by systems (compute nodes) in Cluster (india)
This column chart represents wall time among systems.
  • Period: January 01 – March 31, 2014
  • Cloud(IaaS): openstack, eucalyptus
  • Hostname: india