|
|
FutureGrid Cloud Metric |
|
|
FutureGrid Cloud Metric |
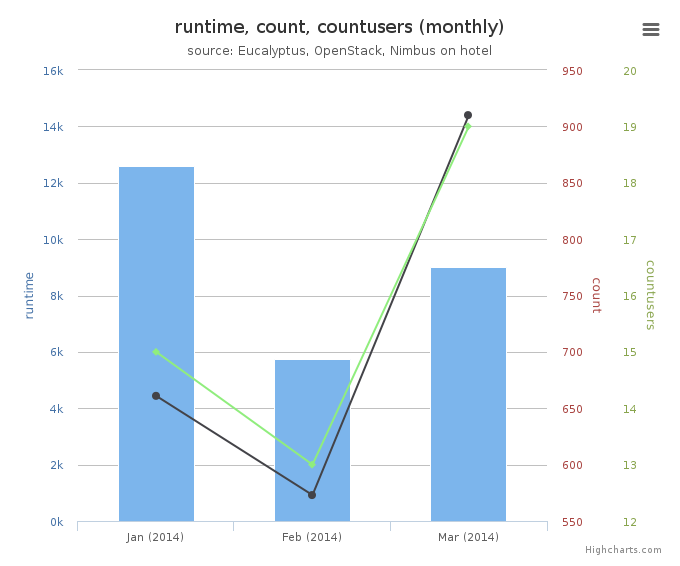
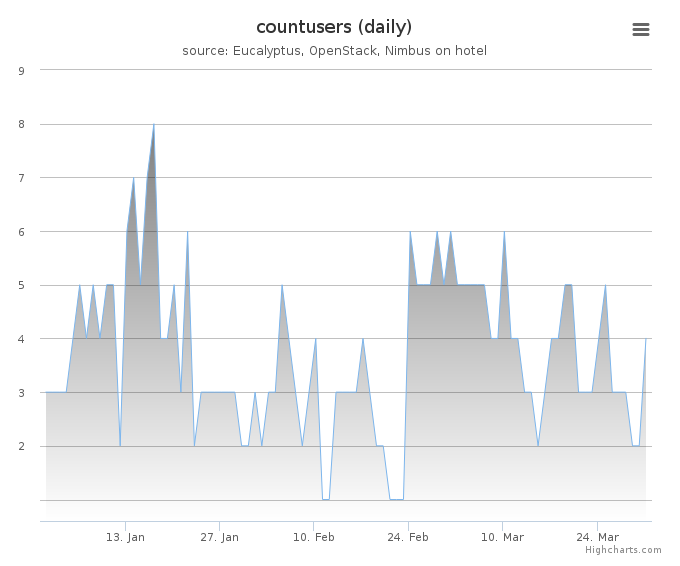
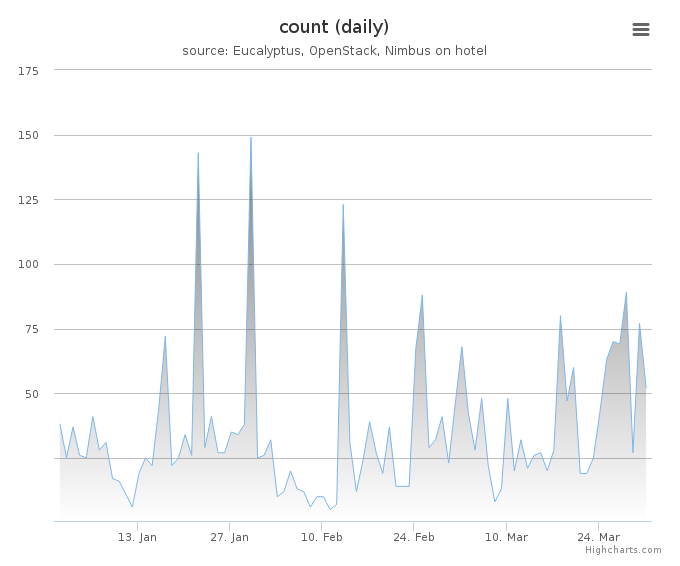
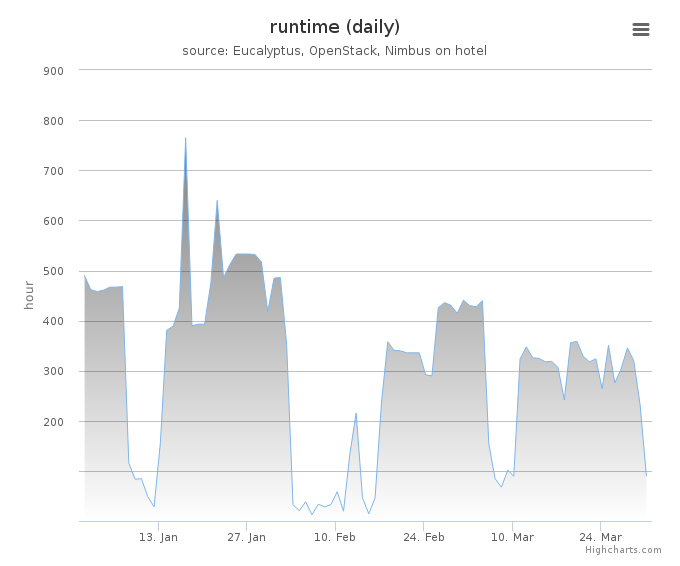
Period: January 01 – March 31, 2014
Cloud(IaaS): nimbus
Hostname: hotel
| Project | Value |
|---|---|
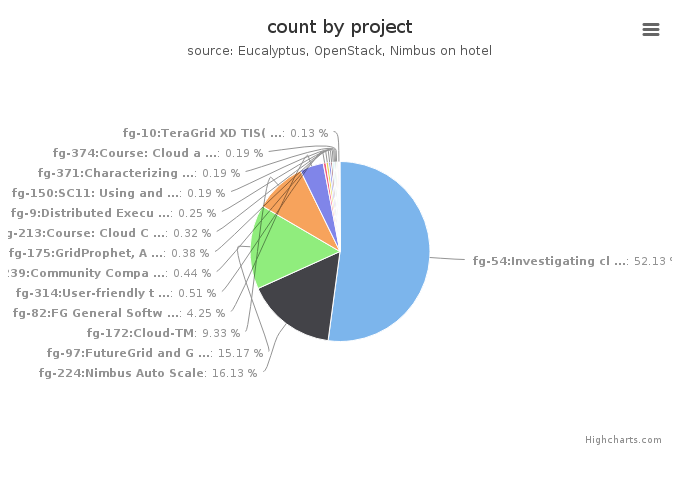
| fg-54:Investigating cloud computing as a solution for analyzing particle physics data | 821 |
| fg-224:Nimbus Auto Scale | 254 |
| fg-97:FutureGrid and Grid‘5000 Collaboration | 239 |
| fg-172:Cloud-TM | 147 |
| fg-82:FG General Software Development | 67 |
| fg-314:User-friendly tools to play with cloud platforms | 8 |
| fg-239:Community Comparison of Cloud frameworks | 7 |
| fg-175:GridProphet, A workflow execution time prediction system for the Grid | 6 |
| fg-213:Course: Cloud Computing class - second edition | 5 |
| fg-9:Distributed Execution of Kepler Scientific Workflow on Future Grid | 4 |
| fg-150:SC11: Using and Building Infrastructure Clouds for Science | 3 |
| fg-371:Characterizing Infrastructure Cloud Performance for Scientific Computing | 3 |
| fg-374:Course: Cloud and Distributed Computing | 3 |
| fg-298:FRIEDA: Flexible Robust Intelligent Elastic Data Management | 2 |
| fg-165:The VIEW Project | 2 |
| fg-10:TeraGrid XD TIS(Technology Insertion Service) Technology Evaluation Laboratory | 2 |
| fg-362:Course: Cloud Computing and Storage (UF) | 1 |
| fg-401:Evaluation of HPC Applications on Cloud Resources | 1 |
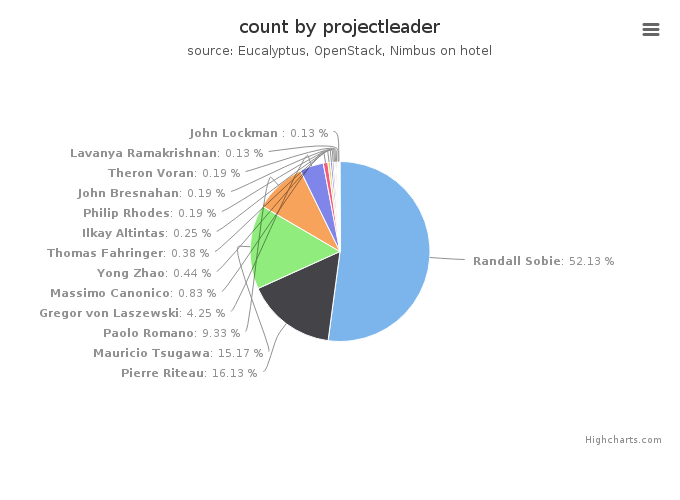
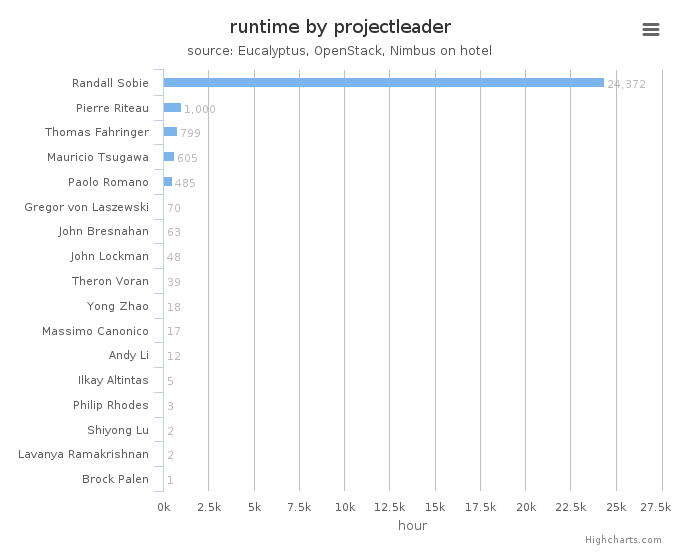
| Projectleader | Value |
|---|---|
| Randall Sobie | 821 |
| Pierre Riteau | 254 |
| Mauricio Tsugawa | 239 |
| Paolo Romano | 147 |
| Gregor von Laszewski | 67 |
| Massimo Canonico | 13 |
| Yong Zhao | 7 |
| Thomas Fahringer | 6 |
| Ilkay Altintas | 4 |
| Philip Rhodes | 3 |
| John Bresnahan | 3 |
| Theron Voran | 3 |
| Shiyong Lu | 2 |
| Lavanya Ramakrishnan | 2 |
| John Lockman | 2 |
| Brock Palen | 1 |
| Andy Li | 1 |

| Institution | Value |
|---|---|
| University of Victoria | 821 |
| University of Chicago | 254 |
| University of Florida | 239 |
| INESC ID | 147 |
| Indiana University | 67 |
| University of Piemonte Orientale, Computer Science Department | 8 |
| University of Electronic Science and Technology | 7 |
| University of Innsbruck | 6 |
| University of Piemonte Orientale | 5 |
| UCSD | 4 |
| Nimbus | 3 |
| University of Colorado at Boulder, Computer Science Department | 3 |
| University of Mississippi, Department of Computer Science | 3 |
| University of Texas at Austin | 2 |
| Lawrence Berkeley National Lab | 2 |
| Wayne State University | 2 |
| U of Michigan / Xsede, CAEN HPC | 1 |
| University of Florida, Department of Electrical and Computer Eng | 1 |
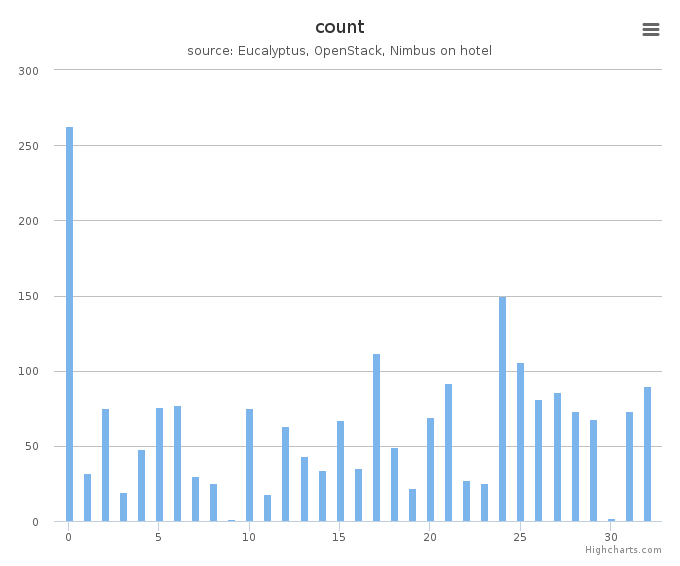
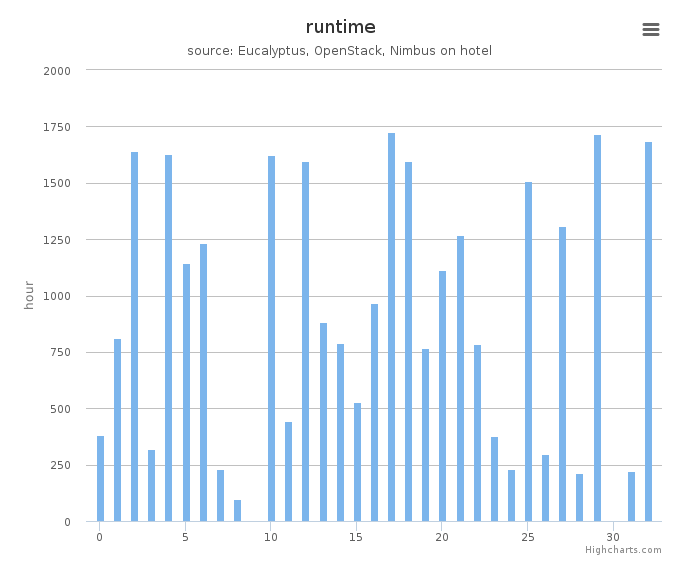
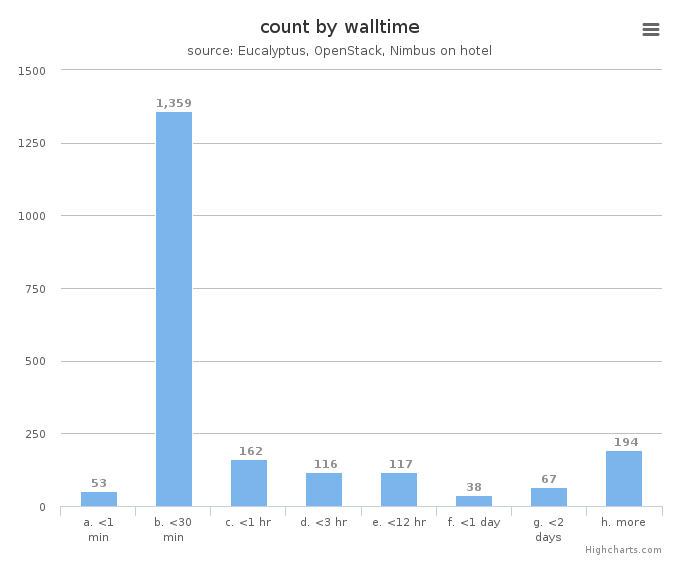
System information shows utilization distribution as to VMs count and wall time. Each cluster represents a compute node.