|
|
FutureGrid Cloud Metric |
|
|
FutureGrid Cloud Metric |
Period: April 01 – June 30, 2014
Cloud(IaaS): nimbus
Hostname: foxtrot
| Project | Value |
|---|---|
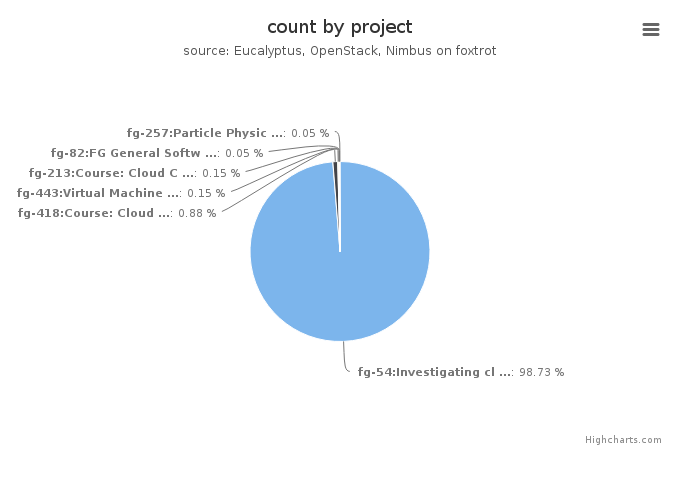
| fg-54:Investigating cloud computing as a solution for analyzing particle physics data | 2026 |
| fg-418:Course: Cloud Computing Class - fourth edition | 18 |
| fg-443:Virtual Machine Live Migration for Disaster Recovery in WANs | 3 |
| fg-213:Course: Cloud Computing class - second edition | 3 |
| fg-82:FG General Software Development | 1 |
| fg-257:Particle Physics Data analysis cluster for ATLAS LHC experiment | 1 |
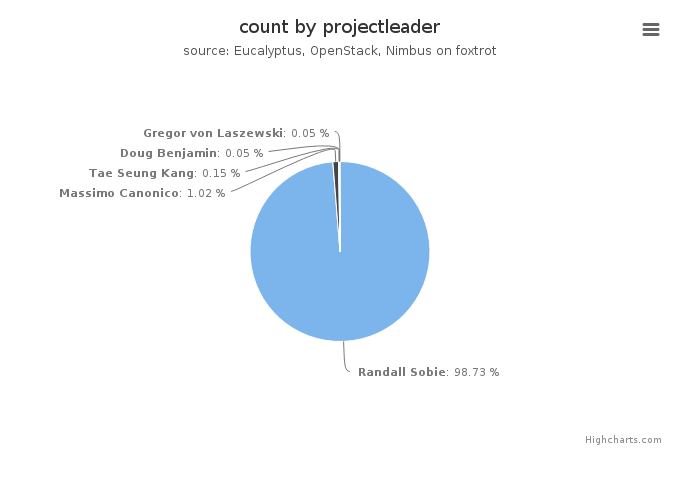
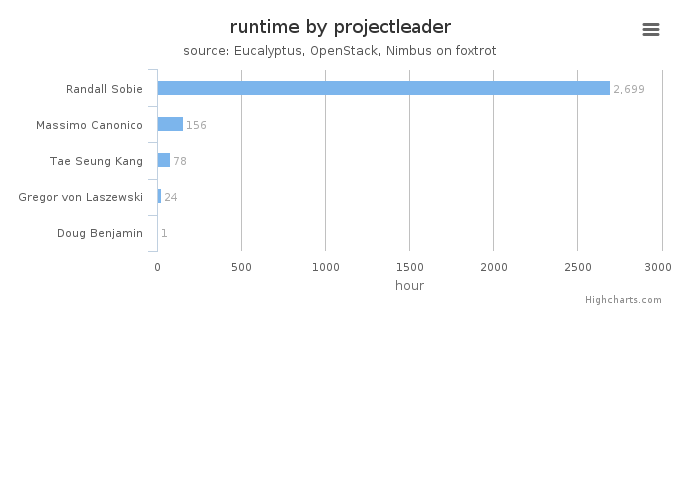
| Projectleader | Value |
|---|---|
| Randall Sobie | 2026 |
| Massimo Canonico | 21 |
| Tae Seung Kang | 3 |
| Doug Benjamin | 1 |
| Gregor von Laszewski | 1 |
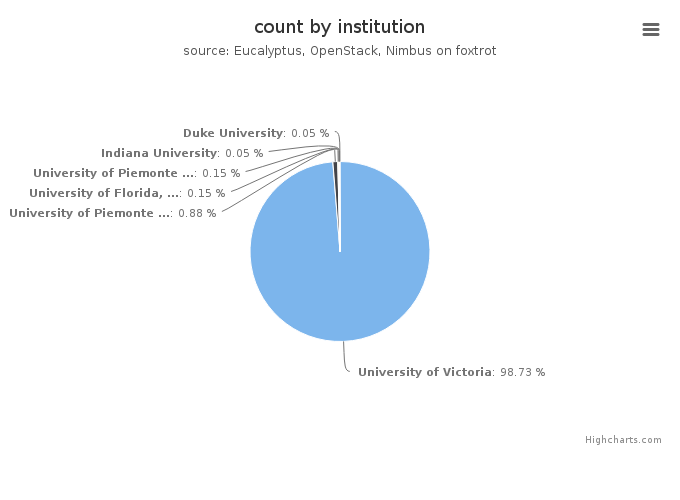
| Institution | Value |
|---|---|
| University of Victoria | 2026 |
| University of Piemonte Orientale, Computer Science Department | 18 |
| University of Florida, Advanced Computing and Information System | 3 |
| University of Piemonte Orientale | 3 |
| Indiana University | 1 |
| Duke University | 1 |
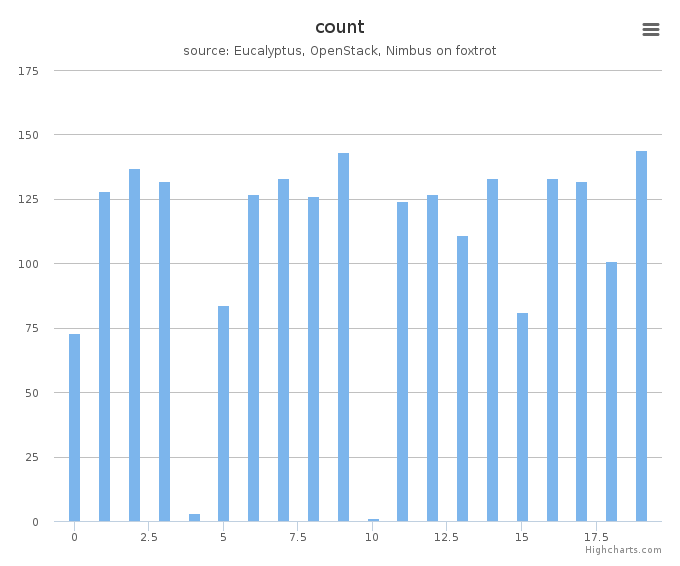
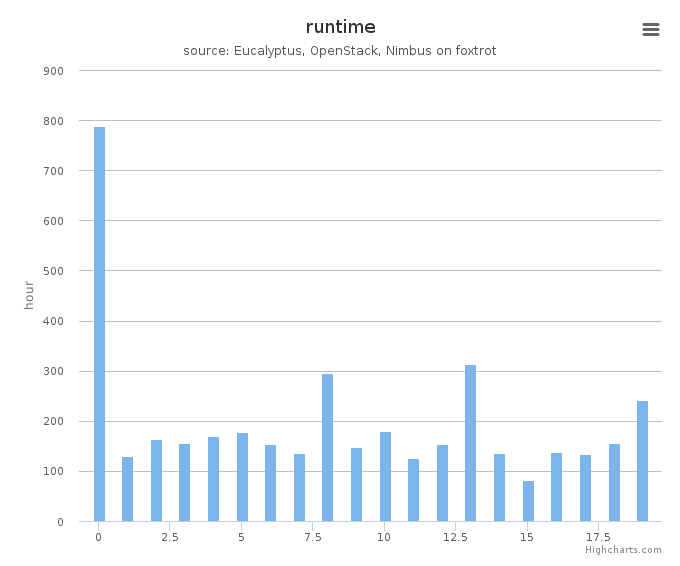
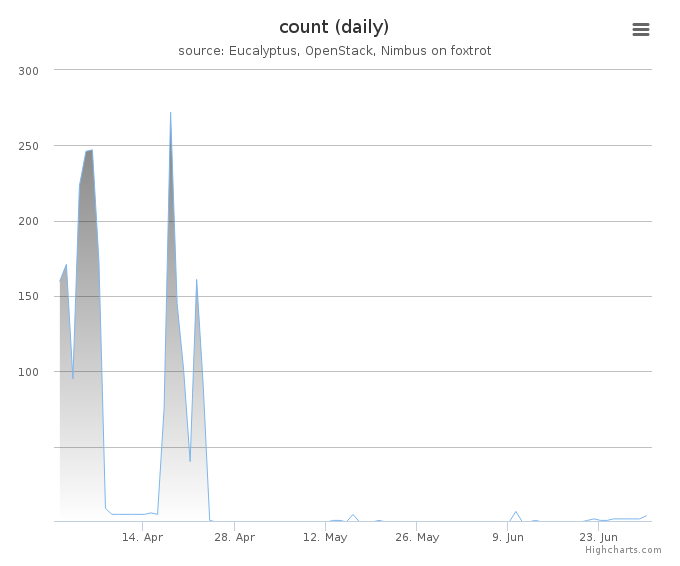
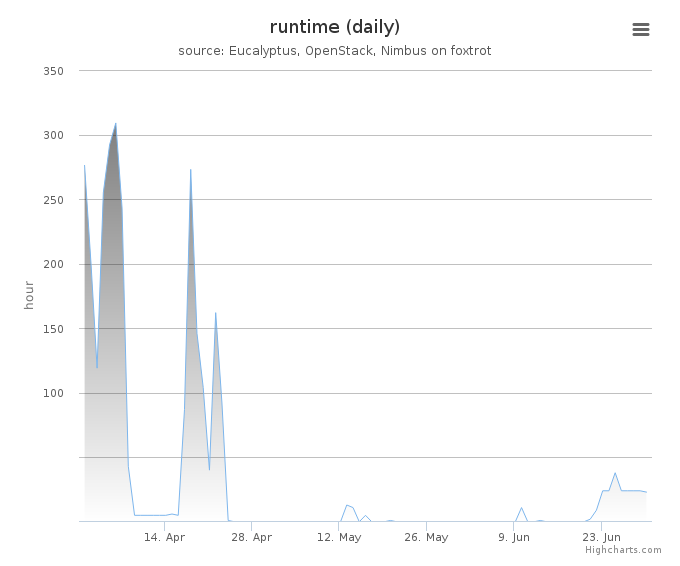
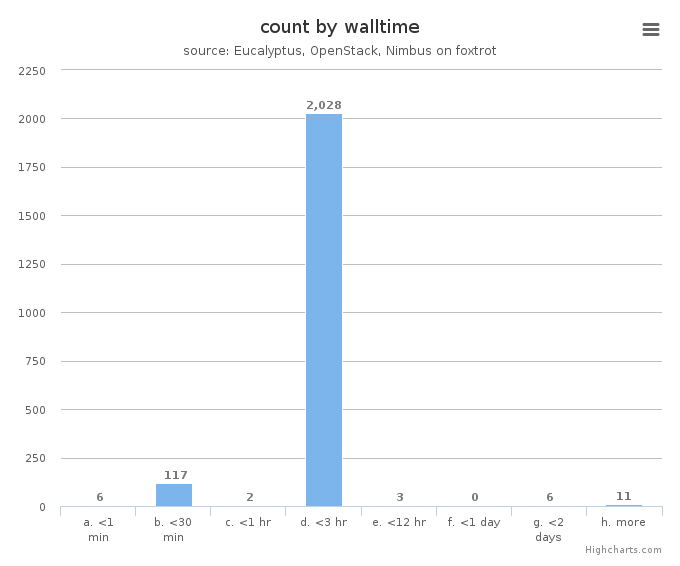
System information shows utilization distribution as to VMs count and wall time. Each cluster represents a compute node.