|
|
FutureGrid Cloud Metric |
|
|
FutureGrid Cloud Metric |
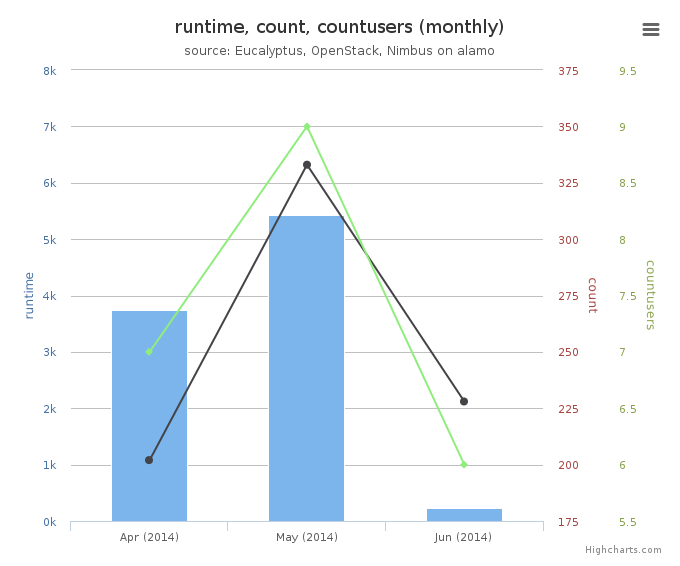
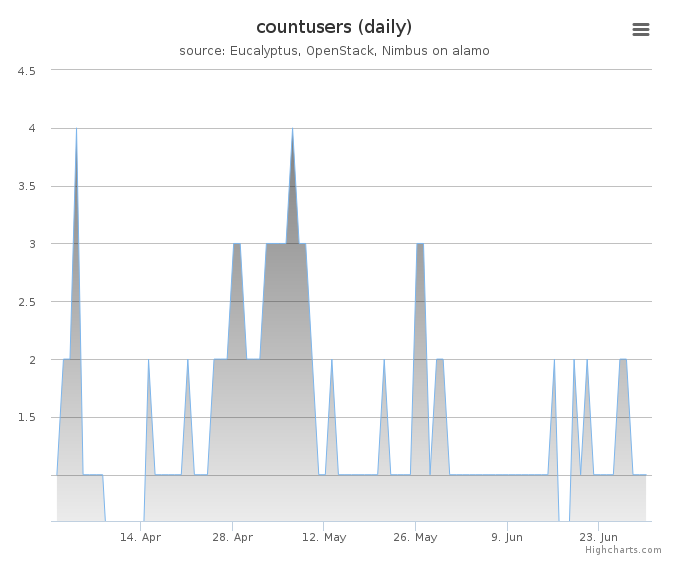
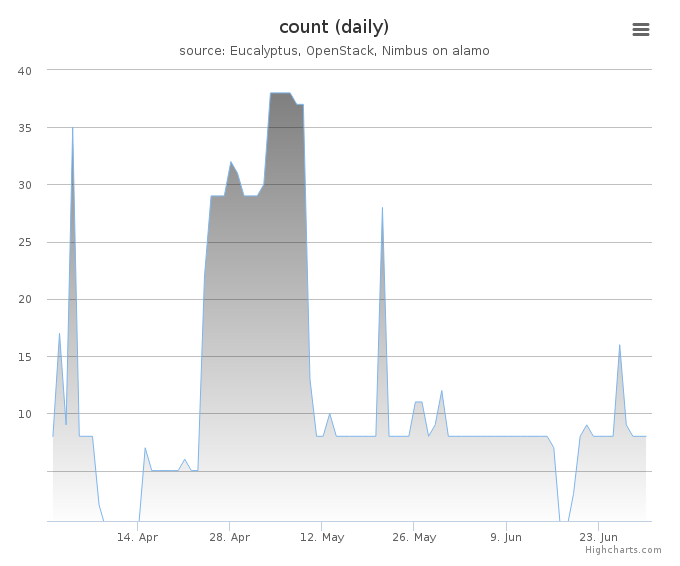
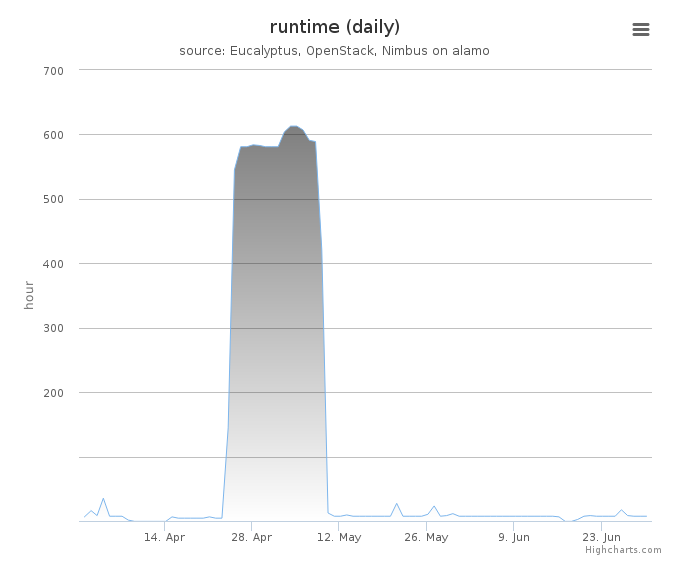
Period: April 01 – June 30, 2014
Cloud(IaaS): nimbus, openstack
Hostname: alamo
| Project | Value |
|---|---|
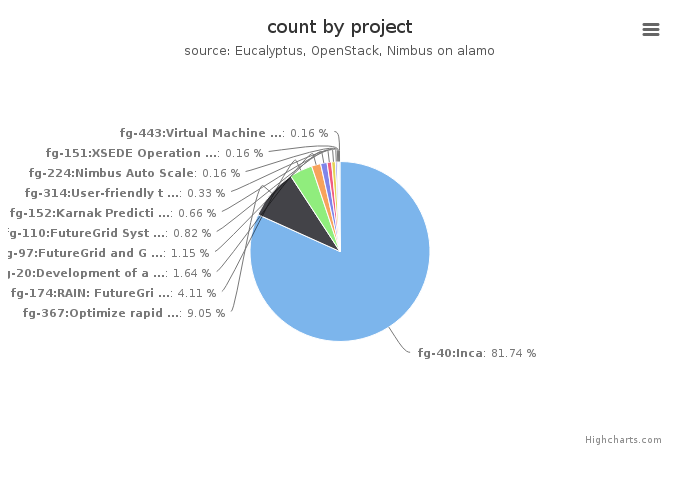
| fg-40:Inca | 497 |
| fg-367:Optimize rapid deployment and updating of VM images at the remote compute cluster | 55 |
| fg-174:RAIN: FutureGrid Dynamic provisioning Framework | 25 |
| fg-20:Development of an information service for FutureGrid | 10 |
| fg-97:FutureGrid and Grid‘5000 Collaboration | 7 |
| fg-110:FutureGrid Systems Development | 5 |
| fg-152:Karnak Prediction Service | 4 |
| fg-314:User-friendly tools to play with cloud platforms | 2 |
| fg-224:Nimbus Auto Scale | 1 |
| fg-151:XSEDE Operations Group | 1 |
| fg-443:Virtual Machine Live Migration for Disaster Recovery in WANs | 1 |
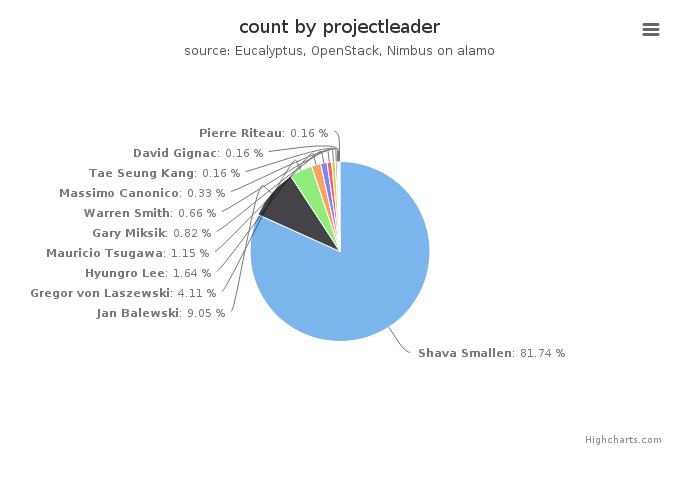
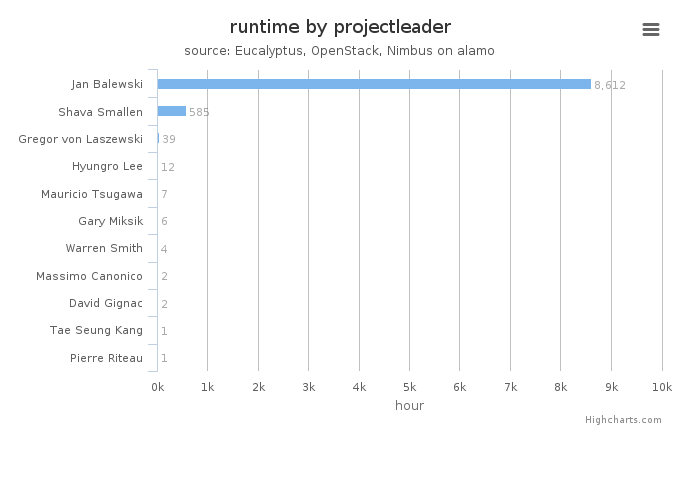
| Projectleader | Value |
|---|---|
| Shava Smallen | 497 |
| Jan Balewski | 55 |
| Gregor von Laszewski | 25 |
| Hyungro Lee | 10 |
| Mauricio Tsugawa | 7 |
| Gary Miksik | 5 |
| Warren Smith | 4 |
| Massimo Canonico | 2 |
| Tae Seung Kang | 1 |
| David Gignac | 1 |
| Pierre Riteau | 1 |
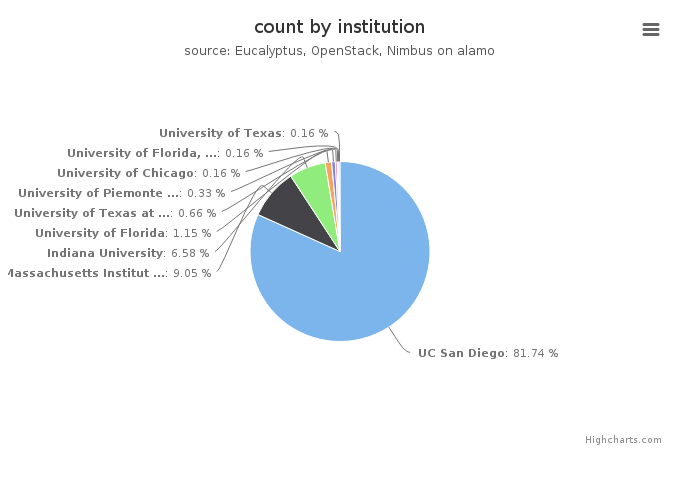
| Institution | Value |
|---|---|
| UC San Diego | 497 |
| Massachusetts Institute of Technology, Laboratory for Nuclear Sc | 55 |
| Indiana University | 40 |
| University of Florida | 7 |
| University of Texas at Austin | 4 |
| University of Piemonte Orientale, Computer Science Department | 2 |
| University of Chicago | 1 |
| University of Florida, Advanced Computing and Information System | 1 |
| University of Texas | 1 |
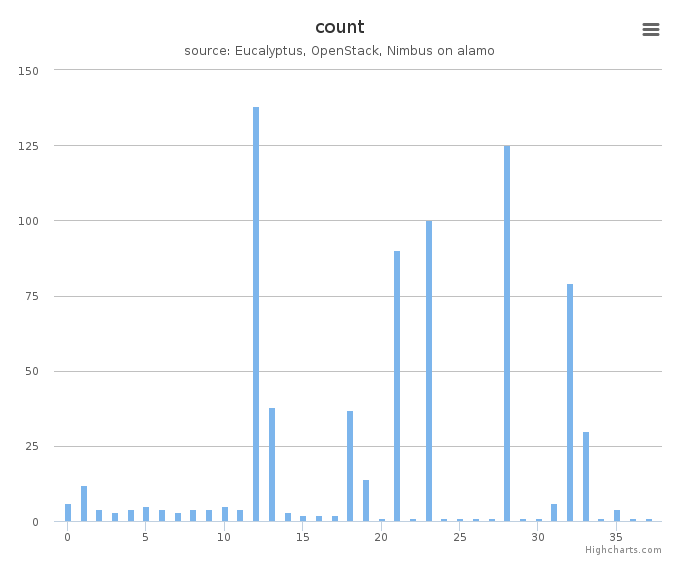
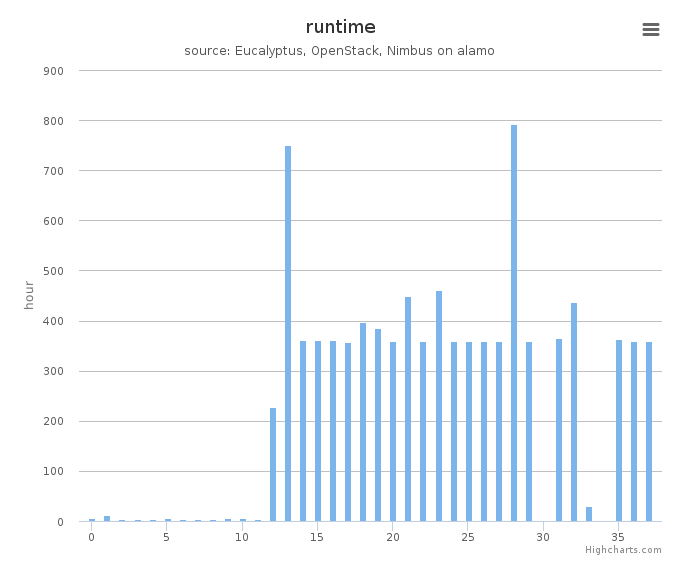
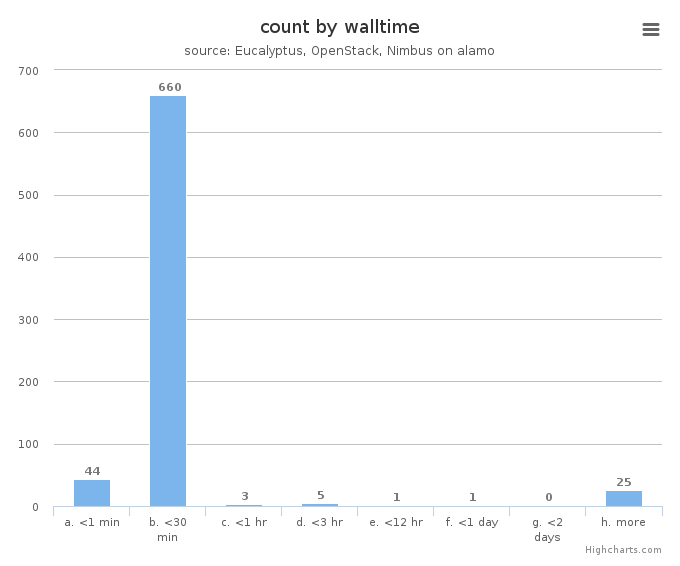
System information shows utilization distribution as to VMs count and wall time. Each cluster represents a compute node.