|
|
FutureGrid Cloud Metric |
|
|
FutureGrid Cloud Metric |
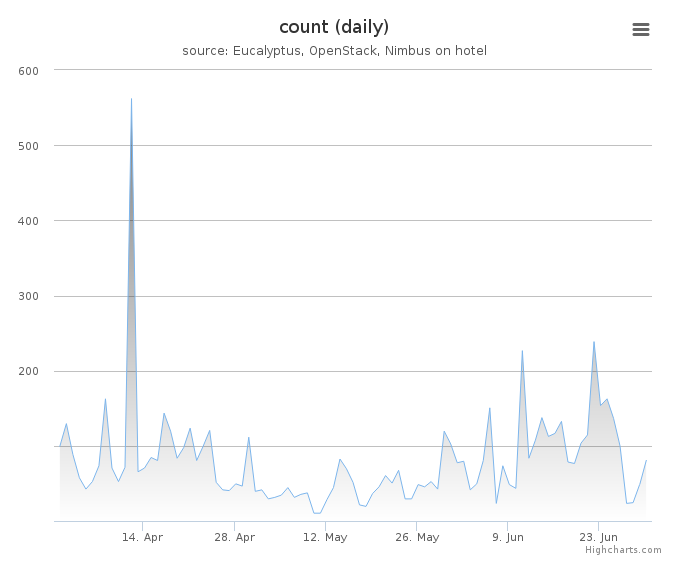
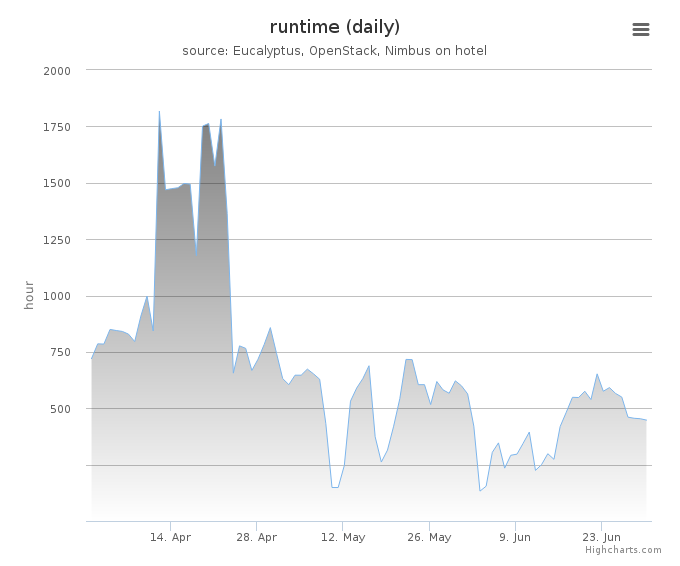
Period: April 01 – June 30, 2014
Cloud(IaaS): nimbus
Hostname: hotel
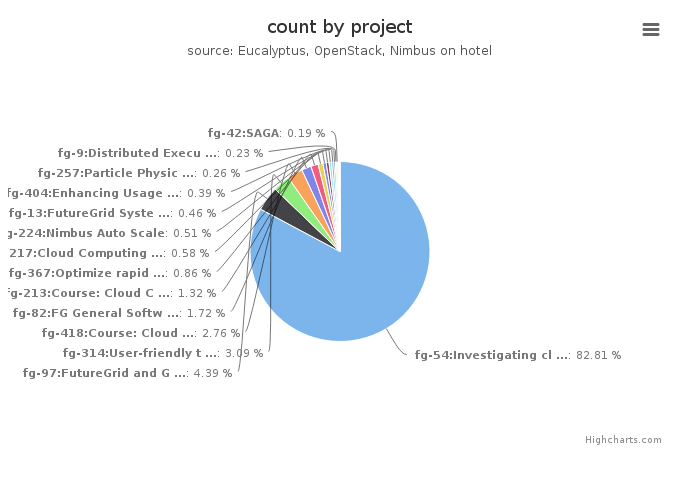
| Project | Value |
|---|---|
| fg-54:Investigating cloud computing as a solution for analyzing particle physics data | 3564 |
| fg-97:FutureGrid and Grid‘5000 Collaboration | 189 |
| fg-314:User-friendly tools to play with cloud platforms | 133 |
| fg-418:Course: Cloud Computing Class - fourth edition | 119 |
| fg-82:FG General Software Development | 74 |
| fg-213:Course: Cloud Computing class - second edition | 57 |
| fg-367:Optimize rapid deployment and updating of VM images at the remote compute cluster | 37 |
| fg-217:Cloud Computing In Education | 25 |
| fg-224:Nimbus Auto Scale | 22 |
| fg-13:FutureGrid Systems Development and Prototyping | 20 |
| fg-404:Enhancing Usage of cloud Infrastructure | 17 |
| fg-257:Particle Physics Data analysis cluster for ATLAS LHC experiment | 11 |
| fg-9:Distributed Execution of Kepler Scientific Workflow on Future Grid | 10 |
| fg-42:SAGA | 8 |
| fg-362:Course: Cloud Computing and Storage (UF) | 7 |
| fg-150:SC11: Using and Building Infrastructure Clouds for Science | 3 |
| fg-341:Course: Parallel Computing | 3 |
| fg-394:Hydroinformatics on the Cloud | 3 |
| fg-344:Exploring map/reduce frameworks for users of traditional HPC | 1 |
| fg-443:Virtual Machine Live Migration for Disaster Recovery in WANs | 1 |
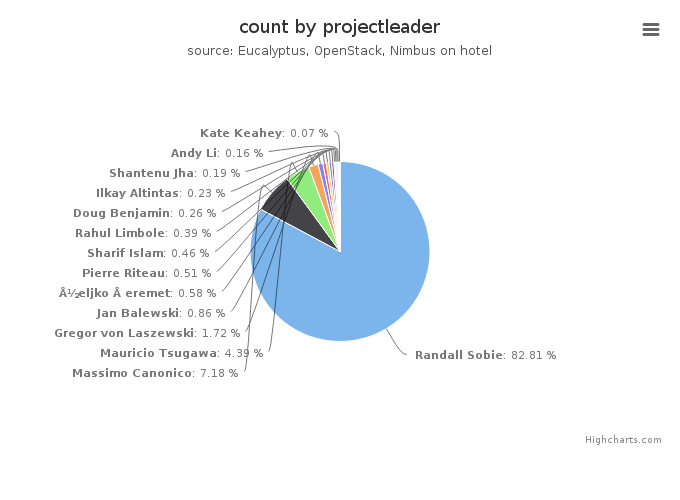
| Projectleader | Value |
|---|---|
| Randall Sobie | 3564 |
| Massimo Canonico | 309 |
| Mauricio Tsugawa | 189 |
| Gregor von Laszewski | 74 |
| Jan Balewski | 37 |
| Željko Šeremet | 25 |
| Pierre Riteau | 22 |
| Sharif Islam | 20 |
| Rahul Limbole | 17 |
| Doug Benjamin | 11 |
| Ilkay Altintas | 10 |
| Shantenu Jha | 8 |
| Andy Li | 7 |
| John Bresnahan | 3 |
| Wilson Rivera | 3 |
| Kate Keahey | 3 |
| Tae Seung Kang | 1 |
| Glenn K. Lockwood | 1 |
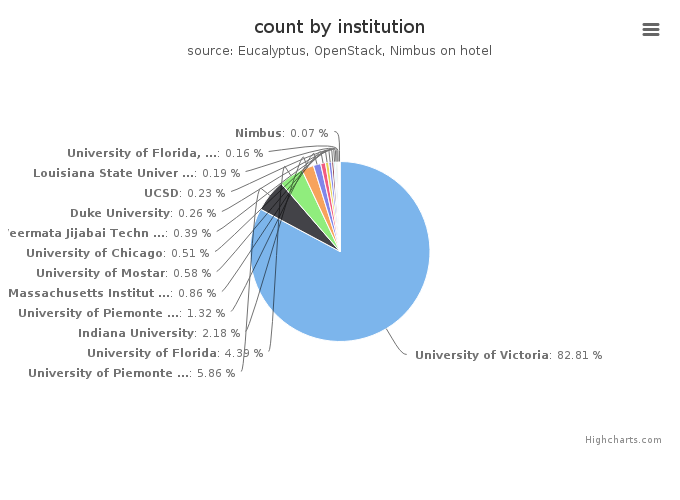
| Institution | Value |
|---|---|
| University of Victoria | 3564 |
| University of Piemonte Orientale, Computer Science Department | 252 |
| University of Florida | 189 |
| Indiana University | 94 |
| University of Piemonte Orientale | 57 |
| Massachusetts Institute of Technology, Laboratory for Nuclear Sc | 37 |
| University of Mostar | 25 |
| University of Chicago | 22 |
| Veermata Jijabai Technological Institute Mumbai, Computer Scienc | 17 |
| Duke University | 11 |
| UCSD | 10 |
| Louisiana State University | 8 |
| University of Florida, Department of Electrical and Computer Eng | 7 |
| University of Chicago, Computation Institute | 3 |
| University of Puerto Rico, Electrical and Computer Emgineering D | 3 |
| Nimbus | 3 |
| University of Florida, Advanced Computing and Information System | 1 |
| University of California San Diego, San Diego Supercomputer Cent | 1 |
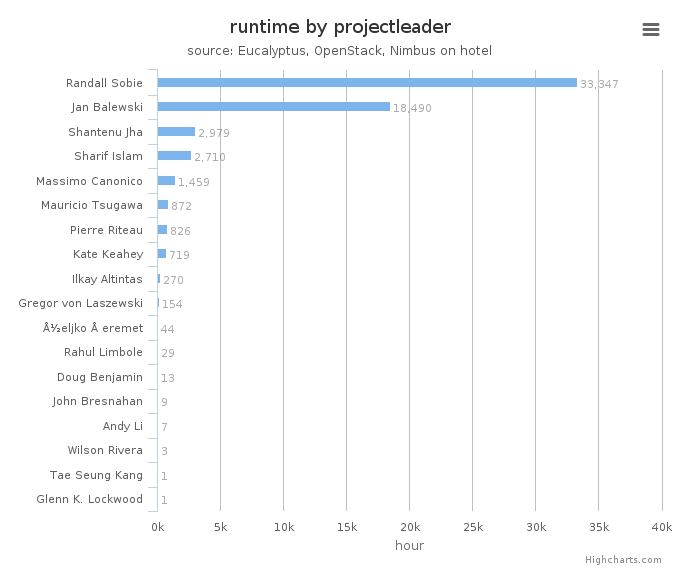
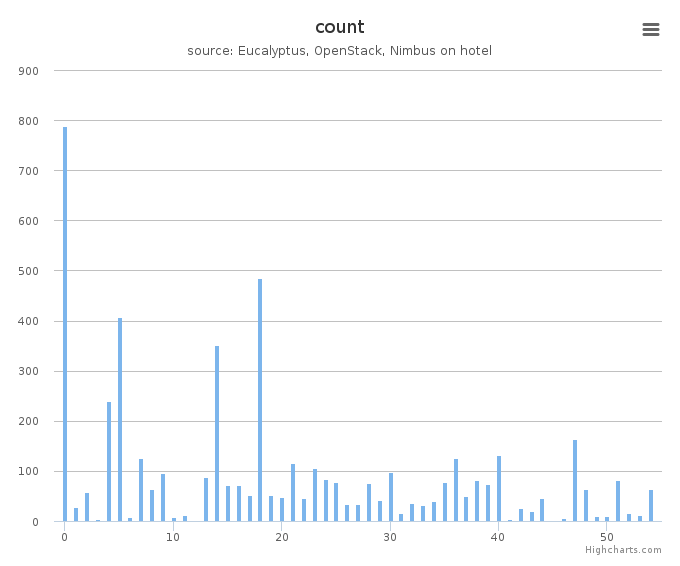
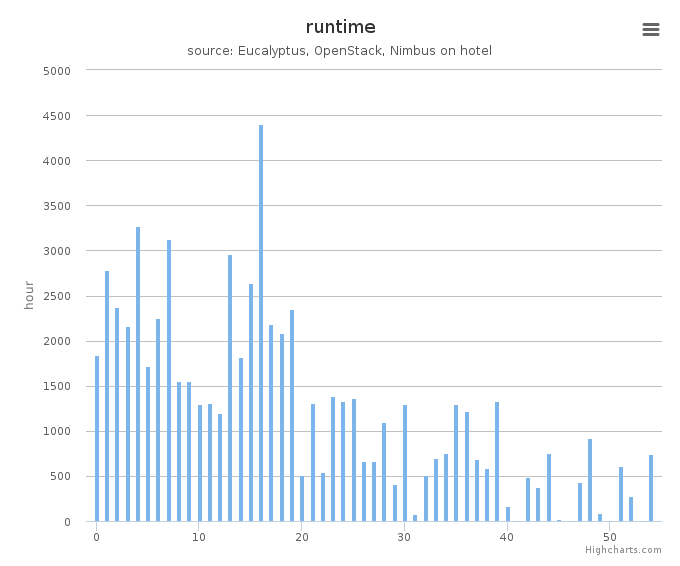
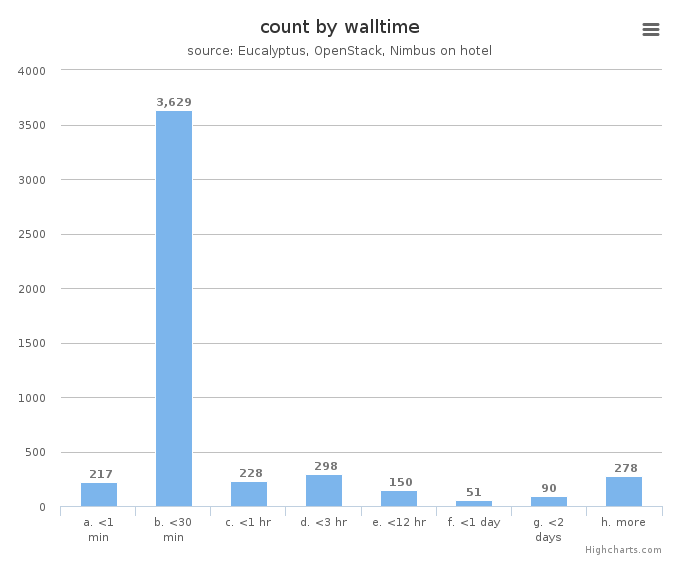
System information shows utilization distribution as to VMs count and wall time. Each cluster represents a compute node.