Periodogram Workflow Running on FutureGrid Using Pegasus
Abstract
Periodogram Workflow Running on FutureGrid Using Pegasus
Intellectual Merit
Sky Computing Using Pegasus
Broader Impact
Shows FG as a Grid/Cloud testbed can deal with large scale workflow execution using Pegasus; Proof of concept that FG can deal with sky computing across sites boundary.
Use of FutureGrid
large scale workflow execution
Scale Of Use
around 150 hosts across 4 FG sites; about 800 tasks; overall several weeks worth of computations, but only a day of resource occupation for each run.
Publications
Results
Pegasus Does Sky Computing
|
Jens-S. Vöckler USC-ISI |
Gideon Juve USC-ISI |
Bruce Berriman IPAC-CalTech |
Ewa Deelman USC-ISI |
Mats Rynge USC-ISI |
A FutureGrid Success Story
The Periodogram workflow searches for extra-solar planets, either by “wobbles” in the radial velocity of a star, or dips in the star’s intensity. In either case, the workflow searches for repeating variations over time in the input “periodogram” data, a sub-set of the light curves released by the Kepler project. The workflow in this scenario only executed the “plav-chan”[1] algorithm, which is the computationally most intense. A full search needs to execute all three algorithms.
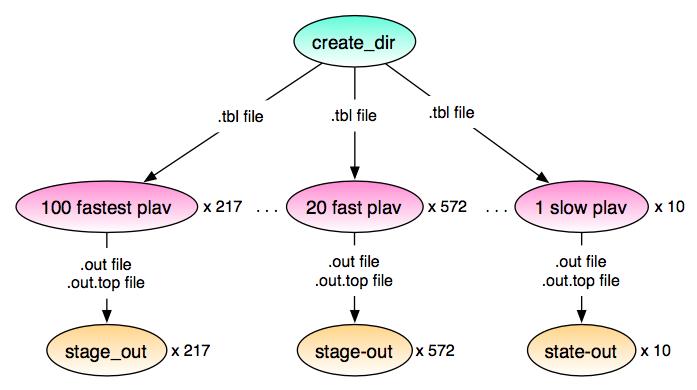
Figure 1: Workflow processing first release with one algorithm.
Figure 1 shows the complete workflow of 1,599 Condor jobs and 33,082 computational tasks, computing every periodogram twice.[2] The top (root) node in the workflow graph is an ancillary job, creating the necessary directory to receive the computational output.
In the first level under the top, the 33k computational tasks were binned into 799 Condor jobs depending on their run-time estimate: extremely fast (sub-second), fast (minutes) and slow (hours). The last bin for extremely fast and fast jobs was not completely filled. Each Condor job stages in all “.tbl” files that the job requires, and stages back all “.out” and “.out.top” result files. The staging happens through Condor-I/O between the submit machine at ISI, and the remote resources in FutureGrid. The “heavy lifting” with regards to staging happens this point.
In the last level, 799 Condor staging jobs, ancillary jobs that Pegasus generated, copy a file on the submit host between directories. This seemingly redundant stage takes almost no time, and is not reflected in the timings except total run-time. We are working on removing this stage from the workflow plan.
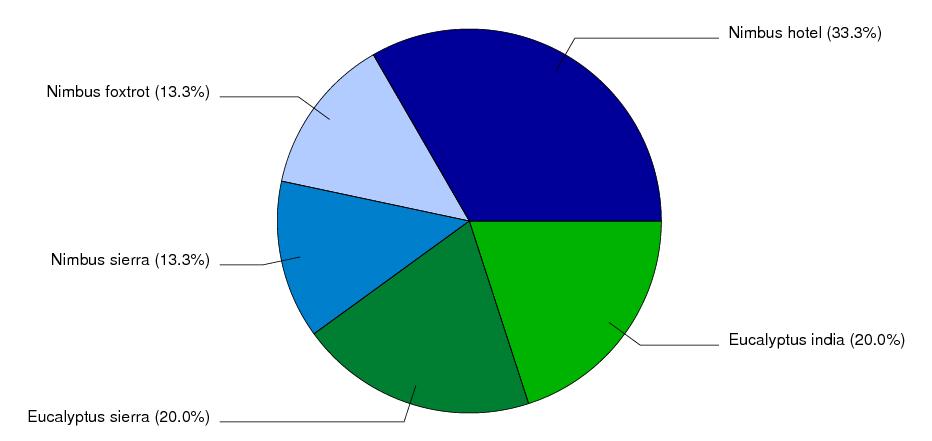
Figure 2: Requested Resources per Cloud.
Figure 2 describes the resource request setup. We requested 90 resources from Nimbus clouds (blues), and 60 from Eucalyptus clouds (greens). 1/3 of combined resources were provided by sierra (SDSC), 1/3 by hotel (UofC), and the final 1/3 shared between india (IU) and foxtrot (UFl). 150 machines in five clouds at four sites with two cloud middleware systems justify the term Sky Computing for this experiment.
The resources boot a Pegasus VM image that has the Periodogram software installed. Each provisioned image, based on a CentOS 5.5 system, brings up a Condor startd, which reports back to a Condor collector at ISI. As much as possible, we tried to request non-public IP modes, necessitating the use of the Condor connection broker (CCB).
On the provisioned image, each host came up with 2 cores, and each core had 2 Condor slots assigned to it. This computational over-subscription of the remote resources is considered not harmful for the periodogram workflow. Further experimentation will be required to validate this decision.
The provision requests were entered manually, using the Nimbus- and Eucalyptus client tools. After the first resources started reporting back to the Condor collector, the Pegasus-planned workflow was started, resulting in an instance of Condor DAGMan executing the workflow. Once the workflow terminated successfully, the resources were manually released.
Figure 3 shows a combination of available Condor slots and jobs in various states for the duration of the workflow. The blue line shows the provisioned slots as they become available over time, thus starting in negative time with regards to the workflow. The start of the workflow indicates 0 in the x-axis.
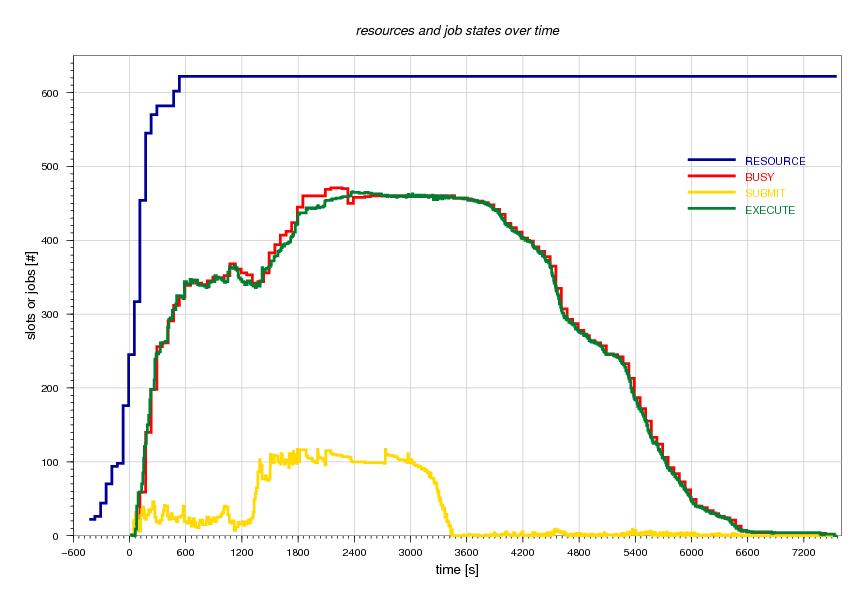
Figure 3: Slots and Job State over time.
The blue line tops out at 622 resource slots. However, since this is a total derived from condor_status, the submit host slots (6) and any other non-participating slots (20) need to be subtracted, bringing the total to 596 slots, or 298 participating cores, or 149 remote hosts. It also shows that a single remote resource never reported back properly.
For this workflow, partial success for a resource request is not a problem. However, other workflows do rely on the all-or-nothing principle, and the middleware should never provision a partial success, unless expressly permitted.
The red line in Figure 3 shows the slots that Condor perceived to be busy. This curve is over-shadowed by the tasks in state executing found in the Condor queue. At one point during the workflow, the number of executing tasks topped out at 466 parallel executing tasks.
The yellow line shows the number of idle tasks in the Condor queue. The workflow manager DAGMan was instructed to only release more jobs into the queue, if there were less than 100 idle jobs. It does not make sense to drop hundreds of jobs into the queue, if only a limited number of them can run. While a maximum of 117 idle jobs does not hit the target perfectly, it is quite sufficient to balance between saturation and scalability.
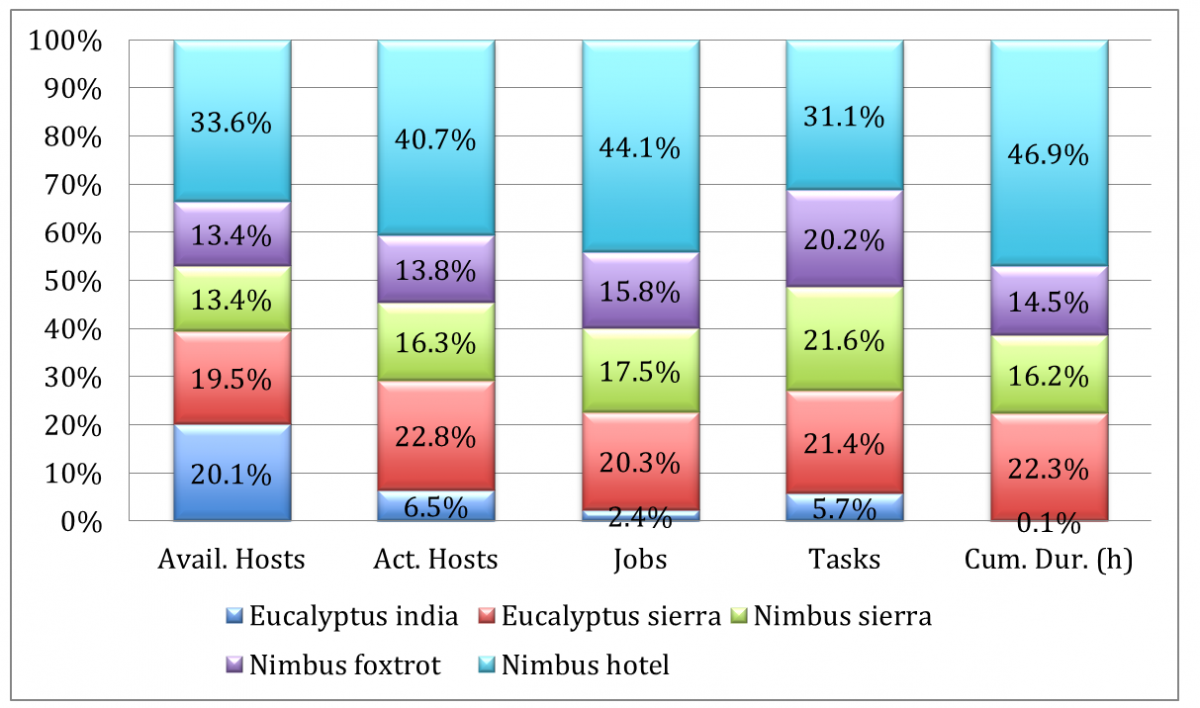
Figure 4: Display of Table 1.
|
Site |
Avail. Hosts |
Active Hosts |
Jobs |
Tasks |
Cumulative Duration (h) |
|
Eucalyptus india |
30 |
8 |
19 |
1900 |
0.4 |
|
Eucalyptus sierra |
29 |
28 |
162 |
7080 |
119.2 |
|
Nimbus sierra |
20 |
20 |
140 |
7134 |
86.8 |
|
Nimbus foxtrot |
20 |
17 |
126 |
6678 |
77.5 |
|
Nimbus hotel |
50 |
50 |
352 |
10290 |
250.6 |
|
TOTAL |
149 |
123 |
799 |
33082 |
534.5 |
Table 1: Statistics about Sites, Jobs and Tasks.
Table 1 and Figure 4 summarize the hosts that, according to Condor, were actually participating in the workflow. With only 123 actively participating hosts that received work from the Condor scheduler, the maximum number of job slots is 492, over 100 slots less than we requested.
Even though the Eucalyptus resources on sierra were only participating with 8 hosts, they managed to deal with 1,900 tasks. The amount of tasks computed per site reflects the number of resources closely, albeit not the time taken.
Overall, the workflow contained over 22 days of computational work, including staging of data. The workflow executed in a little more than 2 hours total workflow duration.
Even though every periodogram was computed twice, input files were staged from separate locations, with 33,082 compressed files totaling 3.4 GB over Condor-I/O. The output totals 66,164 transfers of compressed files with over 5.8 GB size in transferred volume.
|
Size range |
Input .tbl.gz |
Output .top.gz |
Output .out.gz |
|
|
1,024 |
2,047 |
|
606 |
|
|
2,048 |
4,095 |
|
32,476 |
|
|
4,096 |
8,191 |
|
|
|
|
8,192 |
16,383 |
8,457 |
|
|
|
16,384 |
32,767 |
1,065 |
|
|
|
32,768 |
65,535 |
1,297 |
|
21,638 |
|
65,536 |
131,071 |
5,665 |
|
|
|
131,072 |
262,143 |
52 |
|
|
|
262,144 |
524,287 |
1 |
|
11,434 |
|
524,288 |
1,048,575 |
4 |
|
10 |
|
1,048,576 |
2,097,152 |
|
|
|
Table 2: Ranges of compressed input and output sizes.
- [1] Binless phase-dispersion minimization algorithm that identifies periods with coherent phased light curves (i.e., least “dispersed”) regardless of signal shape: Plavchan, Jura, Kirkpatrick, Cutri, and Gallagher. ApJS, 175,19 (2008)
- [2] We will fix this in future re-runs.