

Tracking Metrics Over Time
Jtest saves your project metrics for each test and can graph how each metric changes over time. You can graph the following metrics:
- Number of bytes: Total number of bytes of all class files in the project.
- Number of classes: Total number of classes in the project.
- Number of Java source files: Total number of Java source files in the project.
- Number of lines: Total number of lines in the project's classes.
- Number of packages: Total number of packages in the project.
- Number of package-private classes: Total number of package-private classes in the project.
- Number of private classes: Total number of private classes in the project.
- Number of protected classes: Total number of "protected" classes in the project.
- Number of public classes: Total number of "public" classes in the project.
To track metric information for a specific project:
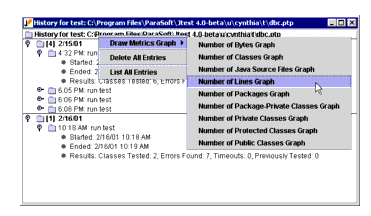
- Open the Test History window by clicking the History button in the Project Testing UI.
- Right-click the History for Test node, then choose Draw Metrics Graph> <Desired Type of Graph> from the shortcut menu.

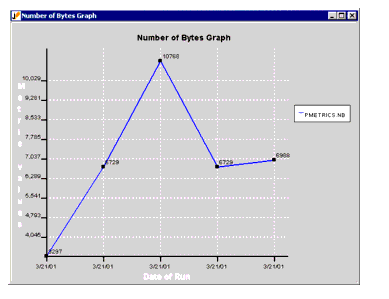
Jtest will then create a graph that displays the specified metrics. The graph's X axis contains date information and it's Y axis contain count information. For example, the Number of Lines Graph contains dates on the X axis and the numbers of lines on the Y axis.

Related Topics
About Static Analysis
Creating Your Own Static Analysis Rules
Viewing Class and Project Metrics
Tracking Metrics Over Time
Customizing Static Analysis


| 

